





Introduction
The Northern Ladoga Zone of the Karelia–Kola Metallogenic Province is one of the most prospective ore districts in northwestern Russia. The region is characterized by a high exploration potential for strategic and critical mineral resources, including rare and rare-earth elements (In, Li, Sc, Y, Ti, etc.) (Ivashchenko 2025). According to the Fennoscandian Ore Database, the northeastern Ladoga region belongs to an area of moderate to high mineral exploration potential (Eilu 2012). The combination of extensive geological and geophysical investigations of the upper crust with the continued potential for discovering concealed mineralization makes the Northern Ladoga region an ideal natural laboratory for developing and testing modern geophysical exploration techniques.

Geophysical methods within the integrated mineral systems approach.
The modern mineral systems concept adopts an integrated, multiscale source–pathway–trap framework, in which ore formation results from the interaction of deep sources of matter and energy, fluid migration pathways, and structural traps controlling mineral deposition (Comeau et al. 2022). In the Northern Ladoga region, this concept is implemented through the construction of integrated geological and geophysical models of the Archean–Paleoproterozoic crustal boundary of the Fennoscandian Shield extending to the upper mantle. Such models provide a basis for investigating the relationships among lithospheric architecture, regional geodynamic evolution, and the spatial distribution of mineral deposits. This approach shifts the emphasis from studies of individual deposits toward the analysis of complete mineral systems and improves the prediction of concealed mineralization at depth. Its geophysical implementation relies on integrating datasets obtained by magnetotelluric sounding (MT), active and passive seismic methods, aeromagnetic surveys based on unmanned aerial vehicles (UAVs), and other geophysical techniques (Figure 1) (Comeau et al. 2021; Darnet et al. 2024).
In the Northern Ladoga region, the practical implementation of this approach is still at an early stage, with ongoing evaluation of the capabilities of different geophysical methods for imaging both regional and local geological structures. Although previous studies have provided detailed information on individual tectonic units, they have not yet resulted in an integrated model of the deep crustal architecture.
This paper presents the first results of a new phase of collaborative geophysical investigations conducted by the Schmidt Institute of Physics of the Earth, Russian Academy of Sciences (IPE RAS), and the Geophysical Center of the Russian Academy of Sciences (GC RAS) to study the structure of the Raahe–Ladoga Zone and adjacent areas of the Northern Ladoga region. During 2023–2024, the same research team carried out multilevel UAV aeromagnetic surveys that provided new insights into the structure of the Valimyaki Massif, an Early Orogenic gabbroic intrusion hosting one of the oldest polymetallic ore deposits in the region (Taran, Aleshin, Bolshakov, et al. 2025; Taran, Aleshin, Matveev, et al. 2025). The present study evaluates the potential of UAV aeromagnetic surveying for mapping regional magnetic anomalies and identifying local subvertical structures, while the microseismic sounding method (MSM) is assessed as a complementary method for delineating inter-block structural boundaries within tectonically complex crustal domains.
Geological Setting
The Northern Ladoga region is characterized by a complex tectonic framework resulting from the juxtaposition of crustal domains of different ages and geodynamic affinities. The southeastern part of the study area belongs to the Paleoproterozoic Svecofennian Orogen and is composed predominantly of high-grade metasedimentary and metavolcanic rocks metamorphosed under amphibolite- to granulite-facies conditions. These rocks commonly host sulfide-bearing and graphite-rich horizons. The northwestern part of the region forms the southeastern margin of the Archean Karelian Craton, where granitoid, tonalitic, and dioritic gneisses and migmatites constitute the exposed crystalline basement. These two crustal domains are separated by the Raahe–Ladoga (Ladoga–Bothnian) Suture Zone, a major lithospheric-scale tectonic boundary extending from the Ladoga area northward into Finland (Mints et al. 2018; Lahtinen et al. 2023).
The Raahe–Ladoga Zone is closely associated with numerous mineral occurrences and ore deposits, including Cu, Ni, and polymetallic mineralization (Ivashchenko 2025, 2024). In addition, tectonically weakened segments of the suture zone are interpreted as preferential pathways for deep-seated fluid migration and accumulation. Such structural and lithological heterogeneity is expected to produce characteristic signatures in multiple geophysical fields. Consequently, integrated interpretation of complementary geophysical datasets provides an effective tool for refining existing geological models and improving understanding of the tectonic evolution of the region.
The Janisjarvi Fault Zone represents one of the principal tectonic elements within the southeastern segment of the Raahe–Ladoga Suture Zone. Its formation is related to the Svecofennian collisional orogeny (ca. 1.90–1.80 Ga), during which island-arc accretion, regional metamorphism, and voluminous granitoid magmatism led to the amalgamation of the Archean and Paleoproterozoic crustal blocks (Lahtinen et al. 2023; Sharov 2020).
Geological mapping studies (Potrubovich et al. 1962; Stepanov et al. 2013; Maksimov et al. 2015) have identified the Janisjarvi Fault Zone as a linear deformation corridor characterized by abrupt lithological contacts and the widespread development of mylonites, cataclasites, and tectonic breccias. Integrated interpretation of geological and geophysical data indicates that the deformation zone reaches a width of approximately 15 km and crosscuts major intracrustal discontinuities. Along the Vyborg–Suojärvi profile, the fault exhibits a near-vertical geometry, in contrast to the regional Archean–Svecofennian contact, which dips southwestward at angles of approximately 60


Fragment of the 1:1,000,000 geological map of the Northern Ladoga region (Maksimov et al. 2015) showing the locations of the 2013–2015 Vyborg–Suojärvi magnetotelluric sounding sites (black diamonds) and the 2025 UAV aeromagnetic survey profiles (thick black line) within the Janisjarvi Fault Zone (thin black line).
The study area, corresponding to the Janisjarvi subzone of the Northern Ladoga structural–formational zone (Figure 2), comprises both Archean crystalline basement rocks and Paleoproterozoic supracrustal successions juxtaposed along the Janisjarvi Fault Zone. The Archean basement consists mainly of granitoid gneisses and migmatites of the Karelian Craton, whereas the Paleoproterozoic succession includes metavolcanic and metasedimentary rocks of the Sortavala and Ladoga groups forming the eastern limb of the Janisjarvi syncline. Within the fault zone, these lithological units have undergone intense tectonic reworking, manifested by isoclinal folding, pervasive schistosity, mylonitization, and brittle deformation.
The lower part of the Paleoproterozoic succession is represented by Jatulian platform deposits that progressively pinch out southward and are overlain by distal facies of Ludicovian volcanic rocks (Soanlakhti Formation) and rhythmically bedded flysch-type sediments of the Kalevian Supergroup (Stepanov et al. 2013). The upper structural level forms a linear basin composed of two branches. The northwestern branch follows the boundary between the Svecofennian Orogen and the Karelian Craton and is interpreted as a passive-margin foredeep, whereas the meridional branch trends approximately perpendicular to the suture and represents a tectonically active trough. Within this basin, the flysch-type sediments display well-developed turbiditic features and contain abundant volcaniclastic material.
Magmatic rocks, including granitoid intrusions and dyke swarms, are spatially associated with the fault zone and record episodes of post-collisional tectonomagmatic reactivation. The geological structure of the area is further complicated by the overprinting of the Janisjarvi impact structure on the pre-existing tectonic framework.
Particular importance is attached to the Cenozoic reactivation of the Janisjarvi Fault Zone. Although the Fennoscandian Shield is generally regarded as a tectonically stable cratonic region, numerous geological and geophysical studies indicate repeated reactivation of inherited basement faults during the Late Cenozoic and Quaternary (Steblov et al. 2022). As a long-lived lithospheric-scale discontinuity, the Janisjarvi Fault Zone likely served as a preferential zone of stress concentration and renewed deformation during the post-orogenic evolution of the Fennoscandian Shield.
Evolution of Geophysical Investigations Along the Vyborg–Suojärvi Profile
The results of numerous geophysical investigations carried out by Russian and international research groups across the Fennoscandian Shield have provided the basis for a series of one- and two-dimensional models of the electrical conductivity structure of the crust and upper mantle. These data were synthesized by a research team led by T. Korja, who developed the Surface Magnetic fields And Potentials (SMAP) model of integrated crustal conductance for the Fennoscandian Shield (Korja et al. 2014). According to this model, the Raahe–Ladoga Suture Zone, marking the boundary between the Archean Karelian Craton and the Paleoproterozoic Svecofennian Orogen, is associated with a system of laterally extensive crustal conductors. Within the Northern Ladoga region, this conductive feature is known as the Ladoga Conductivity Anomaly (LCA).
The anomaly was first identified by geomagnetic variation sounding in the late 1970s and subsequently described by Rokityansky, Kovtun, and co-workers (Rokityansky et al. 1981). Detailed investigations were later performed using audio-frequency magnetotelluric sounding (AMT) along the Vyborg–Suojärvi profile during the 1980s and 1990s (Sharov 2020; Kovtun et al. 2011). These studies interpreted the LCA as a large, steeply dipping conductive body composed of two principal conductive cores separated by approximately 80 km and spatially associated with major fault zones.
The Raahe–Ladoga Suture Zone is also crossed by the Gdov–Sosnovy Bor–Zelenaya Roshcha–Sortavala–Spasskaya Guba deep seismic reflection profile, which is approximately 540 km long and subparallel to the Vyborg–Suojärvi profile. Between the 1980s and the early 2000s, extensive geophysical investigations were carried out along this profile by Nevskgeologiya and several collaborating organizations. The results were comprehensively summarized in (Sharov 2020). Interpretation of the seismic section across the Northern Ladoga region revealed a thrust of the upper-crustal Svecofennian complexes onto the Archean basement of the Karelian Craton, interpreted as a consequence of Paleoproterozoic island-arc accretion during the Svecofennian orogeny. According to this model, the lower parts of the Svecofennian crust, composed mainly of oceanic lithologies, continue beneath the Karelian Craton into the upper mantle as a relic of subduction. At the lithospheric scale, however, joint inversion of receiver functions and Rayleigh-wave phase velocities recorded by the SVEKALAPKO array (Kozlovskaya et al. 2008) showed that the exposed Ladoga–Bothnian suture is not expressed as a mega-scale structure in the crust and upper mantle, the Archean–Proterozoic transition occupying a considerably broader area than the mapped suture itself. At the local scale, microtremor observations at the Kurkieki site in the Northern Ladoga region showed that the spectral composition of ambient noise reflects the sizes and present-day mobility of structural-tectonic blocks, which increases within the dynamic influence zones of active regional faults (Spungin et al. 2019). This contrast between the smooth lithospheric-scale image and the pronounced block structure seen in profile-scale and local observations implies that the architecture of the suture zone can only be resolved by detailed multi-method studies along profiles—which motivates the seismic component of the present work.
Joint interpretation of the AMT and deep seismic reflection data allowed several major crustal domains to be distinguished within the Northern Ladoga region (Sharov 2020). The Northern Ladoga block of Paleoproterozoic crust is bounded by the Priozersk Fault Zone to the east and the Ruskeala (Sortavala) Fault Zone to the west. Farther west lies the Sortavala block, followed by the Janisjarvi Fault Zone, which is regarded as the principal tectonic boundary between the Svecofennian Orogen and the Karelian Craton. Another important structural element is the Meyeri Thrust Zone, separating the northern and southern tectonic domains of the Northern Ladoga region, which experienced markedly different Paleoproterozoic tectonic evolution.
A new stage of geophysical investigations began with a series of long-period magnetotelluric and geomagnetic variation (MT–MV) soundings carried out along the approximately 200-km-long Vyborg–Suojärvi-2 (Figure 2) profile during 2013–2015 (Sharov 2020; Sokolova et al. 2016). These observations substantially refined the geometry of the Ladoga Conductivity Anomaly, demonstrating that it comprises a complex assemblage of conductive bodies of different origins and scales. A series of moderately southwest-dipping conductive horizons in the upper and middle crust, reaching the surface near mapped fault zones, is linked to deeper conductive structures extending into the lower crust. At lower crustal levels, the conductors exhibit a pronounced southwestward dip and are interpreted as graphite-bearing supracrustal thrust surfaces emplaced during the Paleoproterozoic accretion of the Svecofennian terranes along the southwestern margin of the Karelian Craton (Mints et al. 2018).
In 2025, research teams from the IPE RAS carried out an integrated geophysical field campaign across the Raahe–Ladoga Suture Zone. To ensure direct comparison with the results of the 2013–2015 magnetotelluric and geomagnetic variation (MT–MV) survey, the new measurements were conducted at locations closely corresponding to the previous observation sites (Figure 3). The first stage focused on the segment of the Vyborg–Suojärvi profile between stations 01 and 07, crossing the Janisjarvi Fault Zone. High-resolution UAV aeromagnetic surveying and passive seismic microtremor sounding were performed along this section.

Results of the UAV aeromagnetic survey along the Vyborg–Suojärvi profile. (A) Total magnetic intensity (TMI) anomaly profiles acquired along the North and South survey lines. (B) Map of the magnetic anomaly field between the two survey lines overlain on the neotectonic map. Crosses indicate the locations of the 2013–2015 MT–MV sounding sites (Sokolova et al. 2016); the same locations were reoccupied for the 2025 passive seismic microtremor sounding (MSM) stations. On the neotectonic map, pink areas denote zones of weak uplift, whereas green areas indicate areas of intense differential vertical movements dominated by subsidence. Dashed lines mark the mapped traces of reactivated faults within the Janisjarvi Fault Zone.
UAV Aeromagnetic Survey
To investigate the shallow crustal structure, low-altitude UAV aeromagnetic surveys were conducted along two parallel profiles separated by approximately 500 m. Unlike conventional airborne surveys using manned aircraft, UAV-based profile acquisition requires specific survey planning because an entire profile cannot usually be completed during a single flight. Flight distance is constrained by battery capacity and weather conditions, and each sortie covers only several kilometers with sufficient battery reserve maintained for a safe return to the launch site. To optimize field operations, two parallel profiles were surveyed using identical flight directions. Adjacent flight segments were designed to overlap, providing crossover points for subsequent data leveling and quality control.
The deployment of magnetic base stations also required special consideration. In regions characterized by complex geological structure, abundant intrusive bodies, and major fault zones, the response to diurnal geomagnetic variations may differ significantly over distances of only a few kilometers. Therefore, multiple base stations were operated simultaneously at different locations within the survey area to monitor possible spatial variations of the geomagnetic field and to apply differential corrections where necessary (Instructions… 1981). During the present survey, however, the amplitudes and temporal behavior of the diurnal variations recorded at the two base stations were nearly identical; consequently, no differential correction was required.
The first stage of the investigation consisted of UAV photogrammetric mapping using a fixed-wing Geoscan-101 platform equipped with a full-frame digital camera. The acquired imagery was processed to generate digital terrain and digital surface models, which were subsequently used for planning terrain-following aeromagnetic flights while maintaining a constant and safe survey height above ground level.
The second stage involved UAV aeromagnetic surveying using a Geoscan-401 multirotor platform equipped with a GeoShark scalar magnetometer. Measurements were acquired along two nearly straight profiles positioned to minimize the offset from the MT–MV stations established during 2013–2015. The northern part of the survey line deviated from the original profile because of the presence of Lake Janisjarvi. For operational safety, magnetic surveying was not conducted over the lake, as the loss of the UAV in the event of a failure would result in irreversible damage to the instrumentation. Consequently, the data acquired after the change in flight direction were excluded from subsequent quantitative modeling because the profile became nearly parallel to the dominant geological strike.
According to the petromagnetic map compiled under the editorship of N. B. Dortman (Dortman 1980) and the recently developed petrophysical database for the Northern Ladoga region (Taran and Aleshin 2025), gabbrodiorites and gabbrodolerites within the study area exhibit relatively high magnetic susceptibilities on the order of several hundred times 
For preliminary evaluation, the newly acquired aeromagnetic data were compared with the regional magnetic anomaly map accompanying the 1:1,000,000 State Geological Map (Potrubovich et al. 1962; Stepanov et al. 2013) (Figure 4A). Although both datasets display similar large-scale anomaly patterns, they differ in absolute amplitude and background level. These discrepancies most likely reflect differences in survey geometry, processing methodology, and interpolation procedures used during compilation of the regional dataset. Because detailed information on the acquisition parameters of the historical survey is unavailable, a rigorous quantitative comparison could not be performed.
The regional magnetic field exhibits an overall increase toward the northeast. This trend may reflect the reduced effective magnetic susceptibility of the Ladoga Group rocks within the Janisjarvi syncline, although contributions from deeper lithospheric structures associated with Paleoproterozoic subduction processes cannot be excluded (Lahtinen et al. 2023).
Three-dimensional spectral inversion of the regional magnetic field was performed using the Priezzhev method implemented in the GIS INTEGRO software package (Mitsyn 2018) (Figure 4B). In addition, two-dimensional inversion of the UAV aeromagnetic profile was carried out using a gradient-descent algorithm implemented in GravMagInv2D (Chepigo et al. 2022) (Figure 4C).
The resulting effective magnetization model was compared with the regional geological structure after (Potrubovich et al. 1962). A folded sequence composed of graphite-bearing and amphibole schists of the Soanlakhti Formation (

Inversion of aeromagnetic data. (A) Total magnetic intensity anomaly curves from regional 1:200,000-scale survey and UAV-based profile aeromagnetic measurements. (B) Three-dimensional spectral inversion of the regional magnetic anomaly field (GIS INTEGRO software (Mitsyn 2018)) overlaid on geological boundaries from the State Geological Map (Potrubovich et al. 1962). (C) Two-dimensional inversion of UAV aeromagnetic profile data (GravMagInv2D software (Chepigo et al. 2022)).
The overlying Kontiosari Formation (


A metagabbro dyke assigned to the Koikary hypabyssal complex (Maksimov et al. 2015) appears in the inversion model as a zone of reduced effective magnetization.
Comparison of the magnetic data with the neotectonic map (Figure 3) reveals a close spatial association between local positive magnetic anomalies and the reactivated Janisjarvi Fault Zone. These anomalies may indicate zones of enhanced fracturing and tectonic reworking related to the late-stage reactivation of the fault. Verification of this interpretation requires additional seismic, geochemical, and hydrogeological investigations aimed at identifying active deformation zones and possible pathways of deep-seated fluid migration.
Microseismic Sounding Method
Active-source techniques such as deep seismic sounding (DSS) and common-depth-point (CDP) reflection profiling provide the most detailed images of the crystalline crust, but they require powerful controlled sources and dense acquisition systems, which makes them prohibitively expensive for reconnaissance studies. Passive methods based on ambient seismic noise offer a cost-effective alternative. Among them, surface-wave tomography has been successfully applied to the Archean–Proterozoic transition of the Fennoscandian Shield using the SVEKALAPKO array data (Kozlovskaya et al. 2008); its main limitation is the need for long-term signal accumulation by a network of simultaneously operating stations. The microseismic sounding method (MSM) (Tsukanov and Gorbatikov 2025; Danilov 2025) requires only a few hours of noise recording at each site and a minimal set of portable instruments. The trade-off for this simplicity is the inability to obtain a reliable velocity model, because the inversion procedure is inherently non-unique (Zhostkov et al. 2015). For this reason, the microseismic data in the present study are analyzed at a qualitative level, in terms of the relative spectral intensity of microseisms using an empirical frequency-to-depth relationship.
The physical basis of the method is that the vertical component of the ambient wavefield, generated predominantly by microseisms, is dominated by the fundamental mode of Rayleigh waves (Sobisevich et al. 2025). A Rayleigh wave of a given frequency responds mainly to heterogeneities located at depths of about one-half of its wavelength. The frequency-to-depth conversion therefore relies on the dispersion curve, which defines the Rayleigh wavelength as a function of frequency; in this study it was computed for the reference global velocity model CRUST 1.0, although a regional model derived from surface-wave observations, such as that of (Kozlovskaya et al. 2008), can equally be used.
Microseismic measurements were carried out in 2025 along the Vyborg–Suojärvi profile between stations 01 and 07, at points coinciding with the MT–MV sounding sites of the 2013–2015 survey. Data were acquired with three-component CME-6111ND broadband seismometers based on molecular-electronic transducer technology; this recently developed instrument combines portability with a low self-noise level, which makes it well suited to the quiet ambient noise conditions of the study area. At each observation point, the ambient noise was recorded for 3 h, after which the instrument was moved to the next site. A reference station of the same type operated continuously throughout the field campaign to monitor temporal variations of the ambient seismic field.
During processing, the averaged amplitude spectrum of each raw record 


Integrated Interpretation of Geophysical Data
For integrated interpretation, geoelectrical sections derived from magnetotelluric (MT) data along the Vyborg–Suojärvi profile were additionally used. To delineate subvertical conductive zones, two-dimensional inversion results of the vertical magnetic transfer function (tipper 
The tectonic framework, based on integrated geoelectrical and seismic data from southeastern Fennoscandia, was also considered (Mints et al. 2018; Sharov 2020).
The integrated geophysical model allows the identification of several key structural elements (Figure 5):
- A high-fracture-density block marking the Janisjarvi Fault Zone, identified from MSM and MT data following the conceptual framework of (Sharov 2020);
- A vertically extensive conductive zone with resistivity of 10–100
, locally associated with positive magnetic anomalies in the upper crust;
- Metasedimentary and metavolcanic sequences containing graphite-enriched conductive horizons;
- Thrust boundaries of the Svecofennian orogen (Ladoga Group formations);
- Boundaries of an anomalous layer within the Archean Karelian Craton, inferred from both MSM amplitude anomalies and reduced resistivity values (on the order of
–
) relative to surrounding rocks.

The thrust structure at the boundary between the Svecofennian Orogen and the Karelian Craton, previously identified in geological interpretations of geoelectrical sections (Kovtun et al. 2011; Kozlovskaya et al. 2008), is confirmed and further refined by the combined analysis of magnetic inversion results and MSM data.
Analysis of the MSM profile (Figure 5B) reveals pronounced lateral and vertical variations in the spectral amplitude distribution, described below from the deep to the near-surface part of the section. At depth, the section is dominated by a low-intensity, consolidated response, cut by the trace of the Svecofennian–Karelian suture: a high-amplitude anomaly beneath stations 1–2 that persists through the entire imaged depth range as a steep, subvertical zone, interpreted as marking the thrust boundaries of the Karelian Craton–Svecofennian Orogen contact. The deep root of the corridor is offset slightly to the southwest of its surface trace, indicating a southwestward dip that agrees with the southwest-dipping thrust surfaces of the magnetotelluric sections. This geometry is consistent with a northeast-vergent collisional architecture, in which the Archean Karelian Craton is underthrust beneath the Paleoproterozoic Svecofennian Orogen along southwest-dipping thrust surfaces.
At mid-crustal levels, a particularly robust element is an anomaly in the southwestern part of the profile (stations 4–6, depths of about 5–13 km) that appears consistently as a low-intensity to moderate feature in the MSM section and as a reduced-resistivity body in both magnetotelluric sections (Figure 5C,D). Its consistent detection by three independent methods supports its interpretation as a down-dip segment of the southwest-dipping, graphite-bearing thrust system associated with the Ladoga Conductivity Anomaly, potentially representing a preserved component of the Paleoproterozoic accretionary architecture.
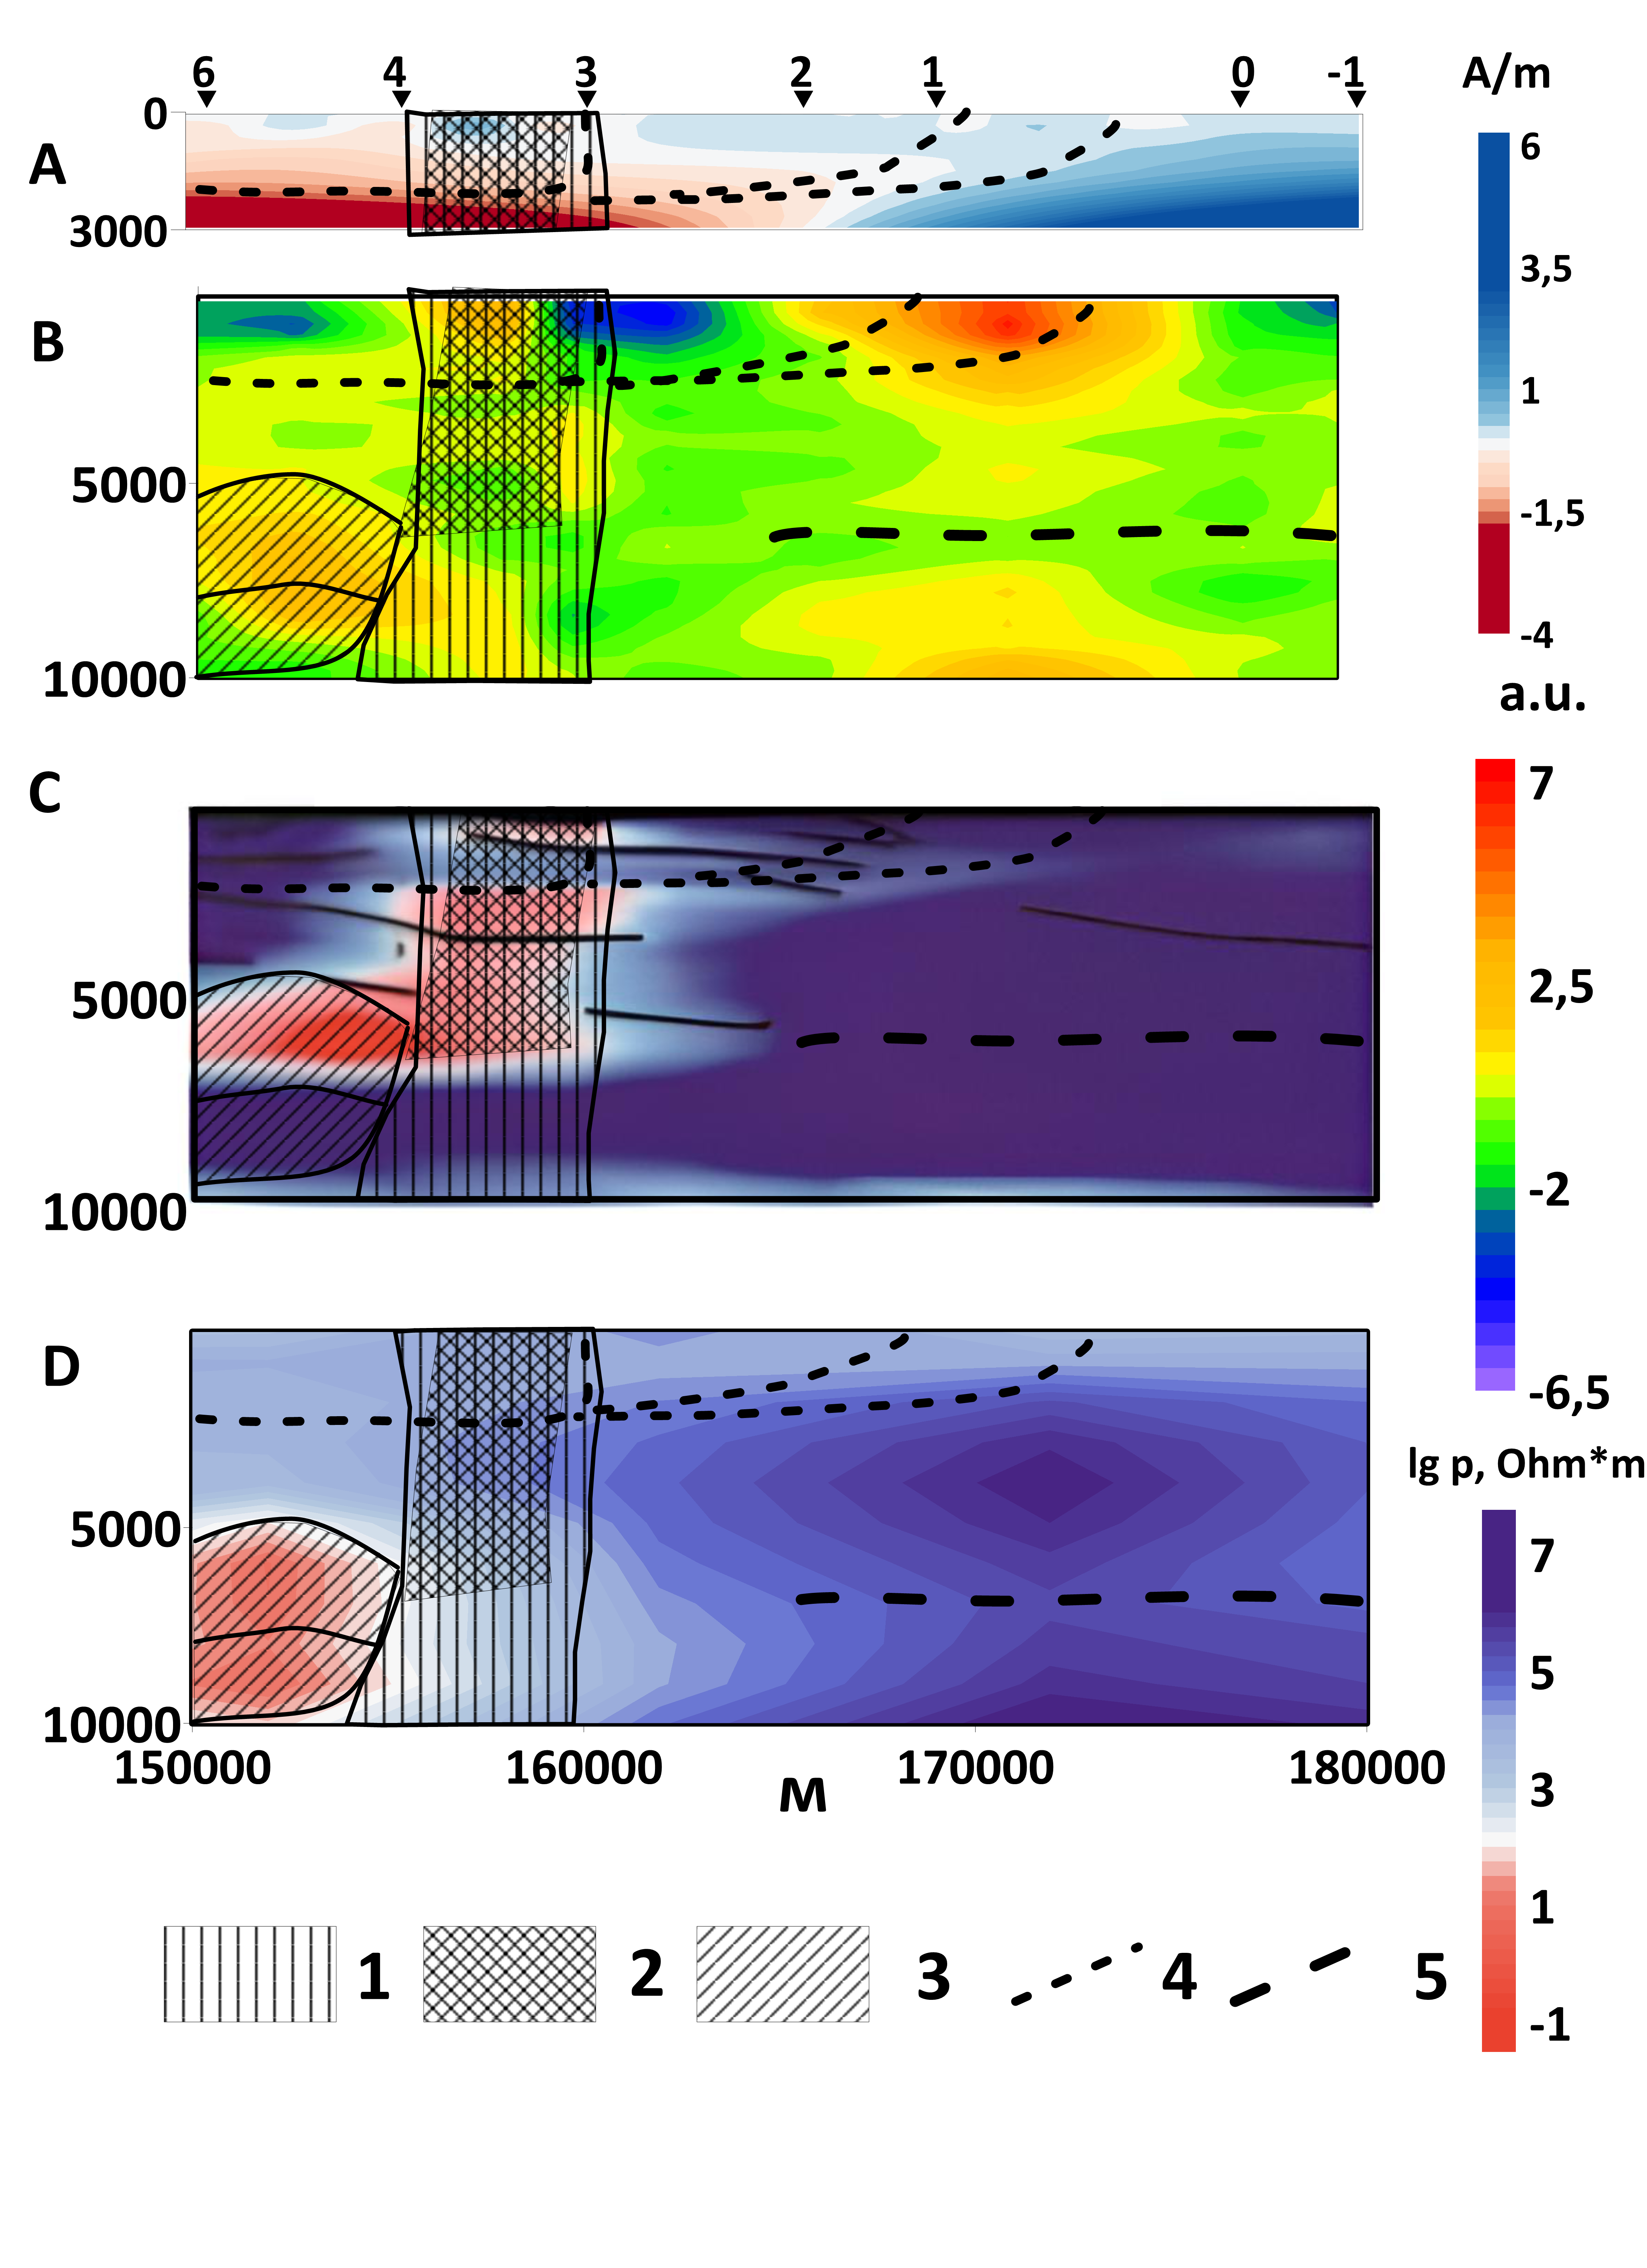
Integrated interpretation of geophysical data across the Janisjarvi Fault Zone. (A) Three-dimensional inversion of the regional magnetic anomaly field; triangles indicate the locations of the 2013–2015 MT/MV sounding sites. (B) Preliminary depth section of spectral amplitudes derived from MSM. (C) Geoelectrical section obtained from two-dimensional inversion of the complex 
Discussion
The MSM section reveals a laterally continuous subhorizontal anomalous zone at a depth of approximately 5–7 km. Its geological interpretation remains uncertain and requires further investigation.
One possible explanation is that this anomaly corresponds to the conductive horizon identified at comparable depths in the magnetotelluric (MT) models derived from impedance tensor inversion. Recent integrated MT and seismic studies indicate that crustal conductive horizons may represent long-lived fluid pathways and rheologically weakened zones within the lithosphere, playing an important role in the architecture of mineral systems (Vadoodi et al. 2021). According to this concept (Pavlenkova 2018), supported by deep seismic sounding studies of Precambrian shields and ancient platforms, the continental crust may contain laterally extensive crustal waveguides characterized by reduced seismic velocities and enhanced seismic reflectivity. The formation of such horizons has been attributed to interconnected systems of microcracks, intergranular voids, and fluids that remain stable under elevated lithostatic pressure owing to sustained tectonic stresses and prolonged geodynamic activity. These zones are interpreted as mechanically weakened layers that may facilitate stress redistribution, deep fluid circulation, and tectono-magmatic processes. In magnetotelluric data, they commonly appear as conductive horizons, whereas in seismic images they are expressed as low-velocity or highly reflective layers.
Within the framework of the mineral systems concept, such crustal waveguides are of particular interest because they may represent important components of lithosphere-scale fluid pathways. Their enhanced permeability and capacity to accumulate fluids make them potential migration pathways for ore-forming fluids and possible intermediate reservoirs linking deep fluid sources with upper-crustal ore-controlling structures. Consequently, the spatial association between conductive and low-velocity horizons and mineralized regions is regarded as an important target of integrated geophysical investigations.
However, an alternative interpretation should also be considered. The detected anomaly occurs at significantly shallower depths than the crustal conductive horizons typically reported beneath the Fennoscandian Shield, which are generally observed at depths of approximately 10–20 km. Moreover, its signature in the MSM section does not fully match the response expected from a classical crustal waveguide. Therefore, the observed anomaly may instead represent another type of geological heterogeneity or may partly reflect methodological limitations associated with passive seismic microtremor sounding and subsequent data processing. Discriminating between these hypotheses requires joint interpretation with independent geophysical datasets, including seismic, magnetotelluric, and potential-field data.
Conclusions
Integrated interpretation of newly acquired UAV-based aeromagnetic data and MSM results together with previously obtained magnetotelluric (MT) data along the Vyborg–Suojärvi profile has refined the structural model of the Janisjarvi Fault Zone and its position along the contact between the Karelian Craton and the Svecofennian Orogen. The results demonstrate the value of integrating geophysical datasets of different spatial resolution for investigating the deep architecture of Precambrian collisional zones in the Fennoscandian Shield.
A spatial correlation has been identified between local magnetic anomalies, electrically conductive zones, tectonic structures, and mapped geological features within the Janisjarvi Fault Zone. These geophysical anomalies are interpreted as manifestations of long-lived structural zones that may have influenced fluid migration and crustal deformation during the geological evolution of the region.
The MSM relative-intensity section indicates a heterogeneous block structure and delineates several steeply dipping to subvertical anomalous zones. Some of these zones spatially coincide with conductive features identified in the magnetotelluric models, supporting their interpretation as tectonically weakened crustal boundaries. The combined datasets are consistent with a southwest-dipping structural architecture at the Karelian Craton–Svecofennian Orogen boundary and with the geometry of the graphite-bearing thrust system associated with the Ladoga Conductivity Anomaly. Nevertheless, these structural interpretations remain non-unique because both the MSM depth conversion and the geophysical inversions depend on methodological assumptions and model constraints.
A laterally continuous subhorizontal anomalous zone was detected at depths of approximately 5–7 km. This feature spatially corresponds to a conductive horizon identified from MT inversion. Although its geological origin remains uncertain, it may represent a mechanically weakened crustal layer associated with enhanced fracturing, fluid accumulation, and long-term stress redistribution within the craton–orogen transition zone.
The contact zone between the Karelian Craton and the Svecofennian Orogen appears to comprise both subvertical permeable structures and laterally extensive crustal horizons that may have acted as fluid pathways and transient reservoirs for ore-forming fluids. Within the mineral systems framework, the identified subvertical structures and laterally extensive crustal horizons represent potential elements of a multiscale structural network that may have facilitated fluid migration during the geological evolution of the region. The present results do not directly demonstrate the presence of ore-forming fluids or mineralization at depth, but they identify geophysical targets for further investigation. Higher-density seismic and magnetotelluric observations, petrophysical measurements, geological validation, and uncertainty analysis are required to test the proposed interpretations and assess the possible relationship between the identified structures and mineralization.
Overall, the study demonstrates that the integration of high-resolution UAV aeromagnetic surveying, passive microseismic sounding, and magnetotelluric imaging can improve the characterization of structurally complex Precambrian crustal boundaries. The resulting model provides a framework for further investigation of the Janisjarvi Fault Zone and for evaluating the role of inherited crustal architecture in the development of mineral systems in the Northern Ladoga region.
Acknowledgments.
The authors are grateful to the colleagues from IPE RAS and GC RAS who took part in the UAV survey and MSM complex, as well as colleagues at All-Russian Oil and Gas Research Institute (VNIGNI) who developed the GIS INTEGRO software.
Funding.
This study was carried out under the State Assignments of IPE RAS and GC RAS.