












Россия
сотрудник с 01.01.2000 по настоящее время
Приморский край, Россия
УДК 55 Геология. Геологические и геофизические науки
УДК 550.34 Сейсмология
УДК 550.383 Главное магнитное поле Земли
ГРНТИ 37.01 Общие вопросы геофизики
ГРНТИ 37.15 Геомагнетизм и высокие слои атмосферы
ГРНТИ 37.25 Океанология
ГРНТИ 37.31 Физика Земли
ГРНТИ 38.01 Общие вопросы геологии
ГРНТИ 36.00 ГЕОДЕЗИЯ. КАРТОГРАФИЯ
ГРНТИ 37.00 ГЕОФИЗИКА
ГРНТИ 38.00 ГЕОЛОГИЯ
ГРНТИ 39.00 ГЕОГРАФИЯ
ГРНТИ 52.00 ГОРНОЕ ДЕЛО
ОКСО 05.00.00 Науки о Земле
ББК 26 Науки о Земле
ТБК 63 Науки о Земле. Экология
BISAC SCI SCIENCE
This paper is devoted to identifying the deformation anomalies in records of the remote unequal-arm laser strainmeters recording Kamchatka earthquakes. We have analyzed data from two North-South-oriented laser strainmeters with 52.5-meter measuring arms and one East-Westoriented laser strainmeter with a 17.5-meter measuring arm, installed in the south of the Primorsky Territory. Deformation anomalies were detected in the laser interference instruments’ records during recording of tsunamigenic earthquakes in July and September 2025. The main characteristics of a tsunami cannot be defined from the recorded deformation anomalies, but they can help calculate the magnitude of seabed displacement in the earthquake epicenter, which is what causes the tsunami.
Tsunamigenic earthquake, laser strainmeter, deformation anomaly, Kamchatka megathrust earthquake
1. Introduction
Tsunamis are relatively rare natural phenomena, but two tsunamigenic earthquakes occurred in the first half of 2024. On January 1, a strong, 7.6 magnitude, earthquake struck off the west coast of Japan, after which the Japan Meteorological Agency registered more than 140 smaller earthquakes of varying magnitudes. This earthquake was the strongest to hit the west coast in over 100 years, and they have been numerous in this region; between May 2018 and December 2024 alone, more than 20,000 were registered, including more than 60 with magnitude greater than 4 [Hirose et al., 2024]. Following the earthquake that occurred on January 1 at 07:12:05 UTC, a tsunami alert was issued across Japan, in some areas waves reached 1.2 m [Conroy, 2024]. A tsunami alert was also issued in Russia, with waves reaching 0.3 m in height off the coast of the Primorsky Territory. According to eyewitnesses, the wave broke ice more than 0.5 m thick in bays of the Primorsky Territory. These short-term warnings were based on magnitude of the earthquake and the position of the epicenter, located at 37.487\(^\circ \)N 137.271\(^\circ \)E at the depth of 10 km [Wei et al., 2014]. The next tsunamigenic earthquake of 2024 occurred at Taiwan on April 2 at 23:58:11 UTC. It was the most powerful earthquake that hit Taiwan in 25 years. This earthquake had magnitude of 7.4 and its epicenter was located at 23.819\(^\circ \)N 121.562\(^\circ \)E at the depth of approximately 40 km. Following this earthquake, a tsunami alert was issued in Japan, with the maximum recorded wave height of 3 m [Mao et al., 2025].
Both earthquakes were registered by the laser strainmeter installed in the south of the Primorsky Territory, Russia [Dolgikh and Dolgikh, 2024]. The distance from the epicenter of the Japan earthquake to the laser strainmeter was approximately 770 km. The signal reached the laser strainmeter in less than 2 min. The signal from the second earthquake, whose epicenter was located approximately 2,264 km away, was recorded approximately 10 min later. Based on laser interference data and the deformation-based method for determining the degree of tsunamigenicity, both earthquakes were classified as tsunamigenic. At the base of the instrument with a 52.5-meter measuring arm, the jump in deformation was 13.5 \(\mu \)m for the Japan earthquake and 1.8 \(\mu \)m for the Taiwan earthquake.
On July 29, 2025, at 23:24:50 UTC, an earthquake with magnitude of 8.8 occurred near the Kamchatka Peninsula at the depth of 35 km. This powerful tsunamigenic earthquake was recorded by laser strainmeters installed in the south of the Primorsky Territory at the Marine Experimental Station (MES) “Shultz Cape” of the Pacific Oceanological Institute of the Far Eastern Branch of the Russian Academy of Sciences (POI FEB RAS). The distance from the laser interference instruments location to the earthquake epicenter was approximately 2,435 km. In addition to this powerful earthquake, laser strainmeters also recorded three tsunamigenic earthquakes in the same area with magnitude greater than 7. The first of them occurred nine days prior to July 20 at 06:49:04 UTC with magnitude of 7.4. The second earthquake of the same magnitude was recorded on September 13 at 02:37:56 UTC, and the third had magnitude of 7.8 and occurred on September 18 at 18:58:15 UTC. We will analyze the records of unequal-arm laser strainmeters at the moment of these earthquakes registration and identify deformation anomalies characteristic of tsunamigenic earthquakes. Using the magnitude of this anomaly and calculations presented in [Dolgikh and Dolgikh, 2021, 2023], we will estimate the magnitude of the seabed displacement in the earthquake epicenter and compare it with the calculated data provided on the website of the US Geophysical Survey.
2. Description of the Instrumentation and Earthquake Data
In this paper we analyze experimental data from three unequal-arm laser strainmeters installed at the “Shultz Cape” MES, POI FEB RAS. The measuring arm of the first instrument (NS-1) is oriented along the azimuth of 198\(^\circ \) and is 52.5 m long. Its central interference unit is located on a 3.5-meter-high granite-concrete base, installed on the dense granite-clay bedrock. The corner reflector of this laser strainmeter is mounted on a 1-meter-high granite-concrete base and is rigidly connected to the granite rock. The central interference unit of the second laser strainmeter (NS-2) is mounted on the same base. Its 52.5-meter-long measuring arm is oriented along the azimuth of 200\(^\circ \). The corner reflector is mounted on a granite-concrete block placed on a sand cushion approximately 0.5 m thick. The third laser interference instrument (WE) is installed in another room, and its 17.5-meter-long measuring arm is oriented along the azimuth of 290\(^\circ \). The central interference unit and the corner reflector of the instrument are installed on granite-concrete foundations, mounted on dense granite-clay bedrock. All laser strainmeter components are located in underground thermally insulated chambers at the depth of approximately 3 m, at the altitude of approximately 60 m above sea level. All laser interference instruments are based on unequal-arm Michelson interferometer. The light sources used in these devices are frequency-stabilized helium-neon lasers from Melles Griot with long-term stability of 10 \(^{-9}\). The operating frequency range of the laser strainmeters extends from 0 (conditionally) to 1 kHz. The used interferometry methods allow displacement measurements at the instrument base with the accuracy of 10 pm. Data from all instruments is transmitted via cable lines to a recording computer, where, after preliminary processing, they are formed into 1-hour files with sampling frequency of 1 kHz [Dolgikh et al., 2002].
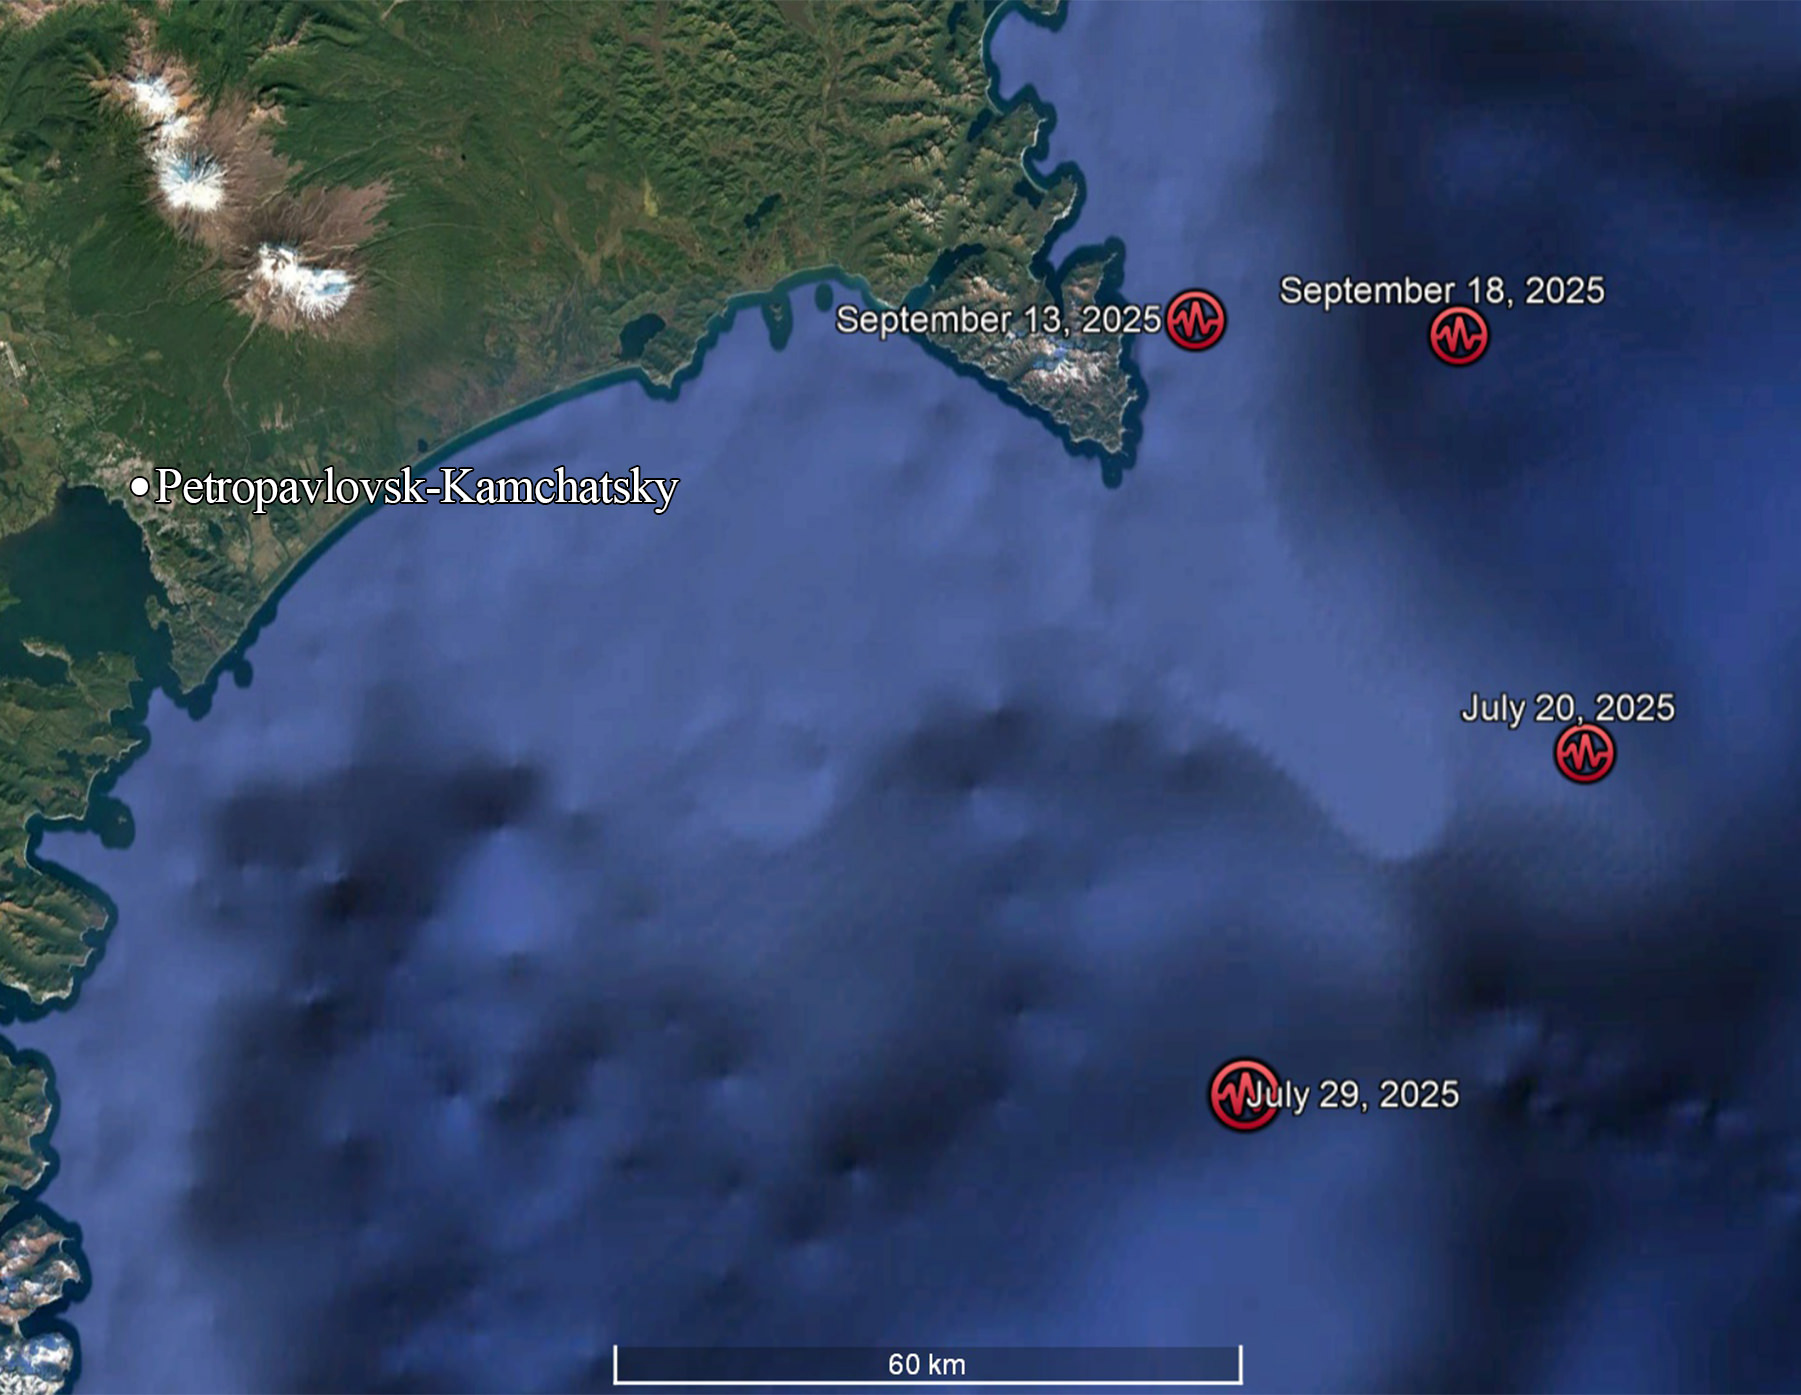
Figure 1 shows a schematic map of the locations of the epicenters of the earthquakes that occurred near the Kamchatka Peninsula in July and September 2025. The first of these earthquakes occurred on July 20, 2025, at 06:49:04 UTC with magnitude of 7.4 at 52.830\(^\circ \)N 160.682\(^\circ \)E at the depth of 34 km. The second, the largest, earthquake occurred on July 29, 2025, at 23:24:52 UTC at 52.495\(^\circ \)N 160.240\(^\circ \)E at the depth of 35 km. Its magnitude was 8.8. The next earthquake with magnitude of 7.4 occurred on September 13, 2025, at 02:37:56 UTC at 53.190\(^\circ \)N 160.143\(^\circ \)E at the depth of 59 km. The most recent of the earthquakes under consideration occurred on September 18, 2025, at 18:58:15 UTC and its magnitude was 7.8, the hypocenter was located at 53.176\(^\circ \)N 160.537\(^\circ \)E at the depth of 30 km. All these earthquakes, according to the US Geological Survey, were classified as tsunamigenic (https://earthquake.usgs.gov).
3. Method and Data Analysis
The essence of the deformation method for determining the tsunamigenicity of earthquakes is in detection of a deformation anomaly. This anomaly was first discovered during the analysis of instrument’s records at the moment of registration of the December 26, 2004 tsunamigenic earthquake [Dolgikh et al., 2007]. Let us consider the first earthquake of July 20, 2025; its first oscillations reached the laser interference instruments at 06:57:54 UTC, that is, in less than 8 minutes. Figure 2 shows fragments of the records of three laser strainmeters at the moment of this earthquake registration.
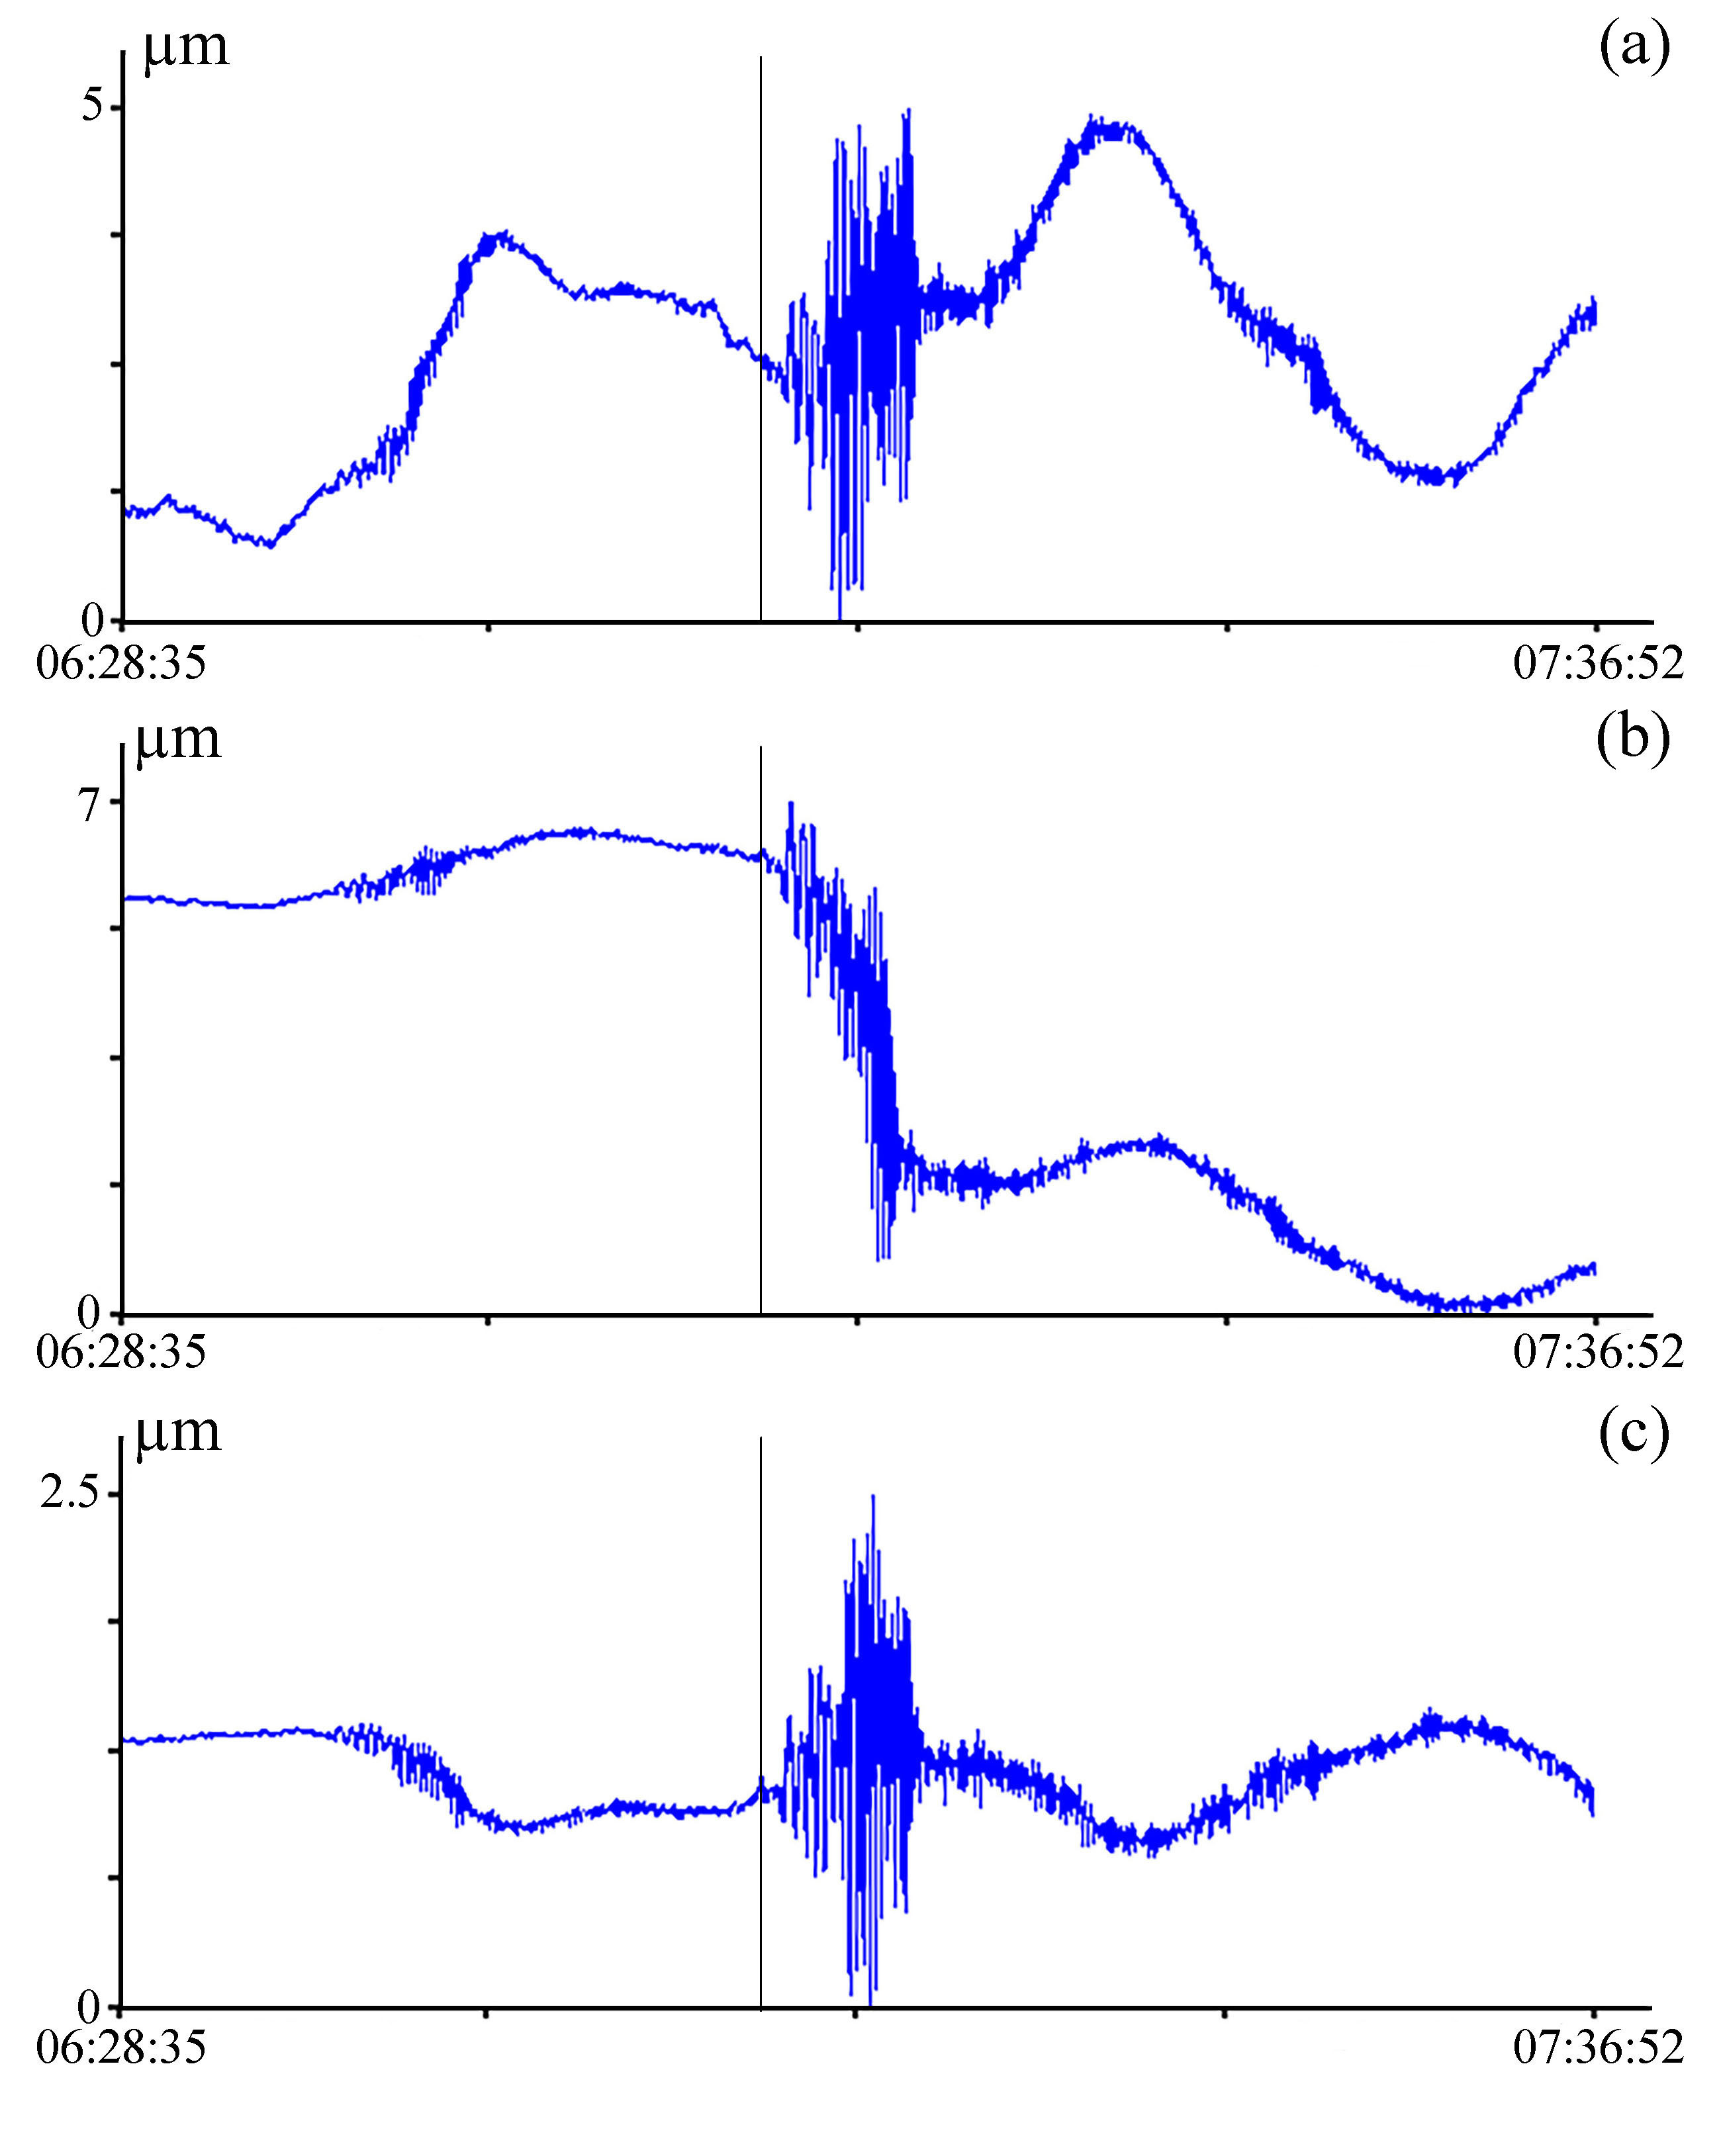
In the record of the 52.5-meter unequal-arm laser strainmeter NS-1 (Figure 2a), the deformation anomaly is not as pronounced as in the record of the laser strainmeter NS-2 (Figure 2b). Immediately after the first oscillations of this earthquake were registered, as indicated by the line, the record begins to shift downward, indicating the tsunamigenic nature of this earthquake. The deformation anomaly is absent in the record of the 17.5-meter laser strainmeter (Figure 2c). Also, the records from all three instruments contain oscillations from a less powerful earthquake that occurred several minutes earlier.
Fragments of laser strainmeter records of the next, most powerful of the earthquakes under consideration are shown in Figure 3. Its first oscillations were received by the instruments at 23:31:16 UTC.
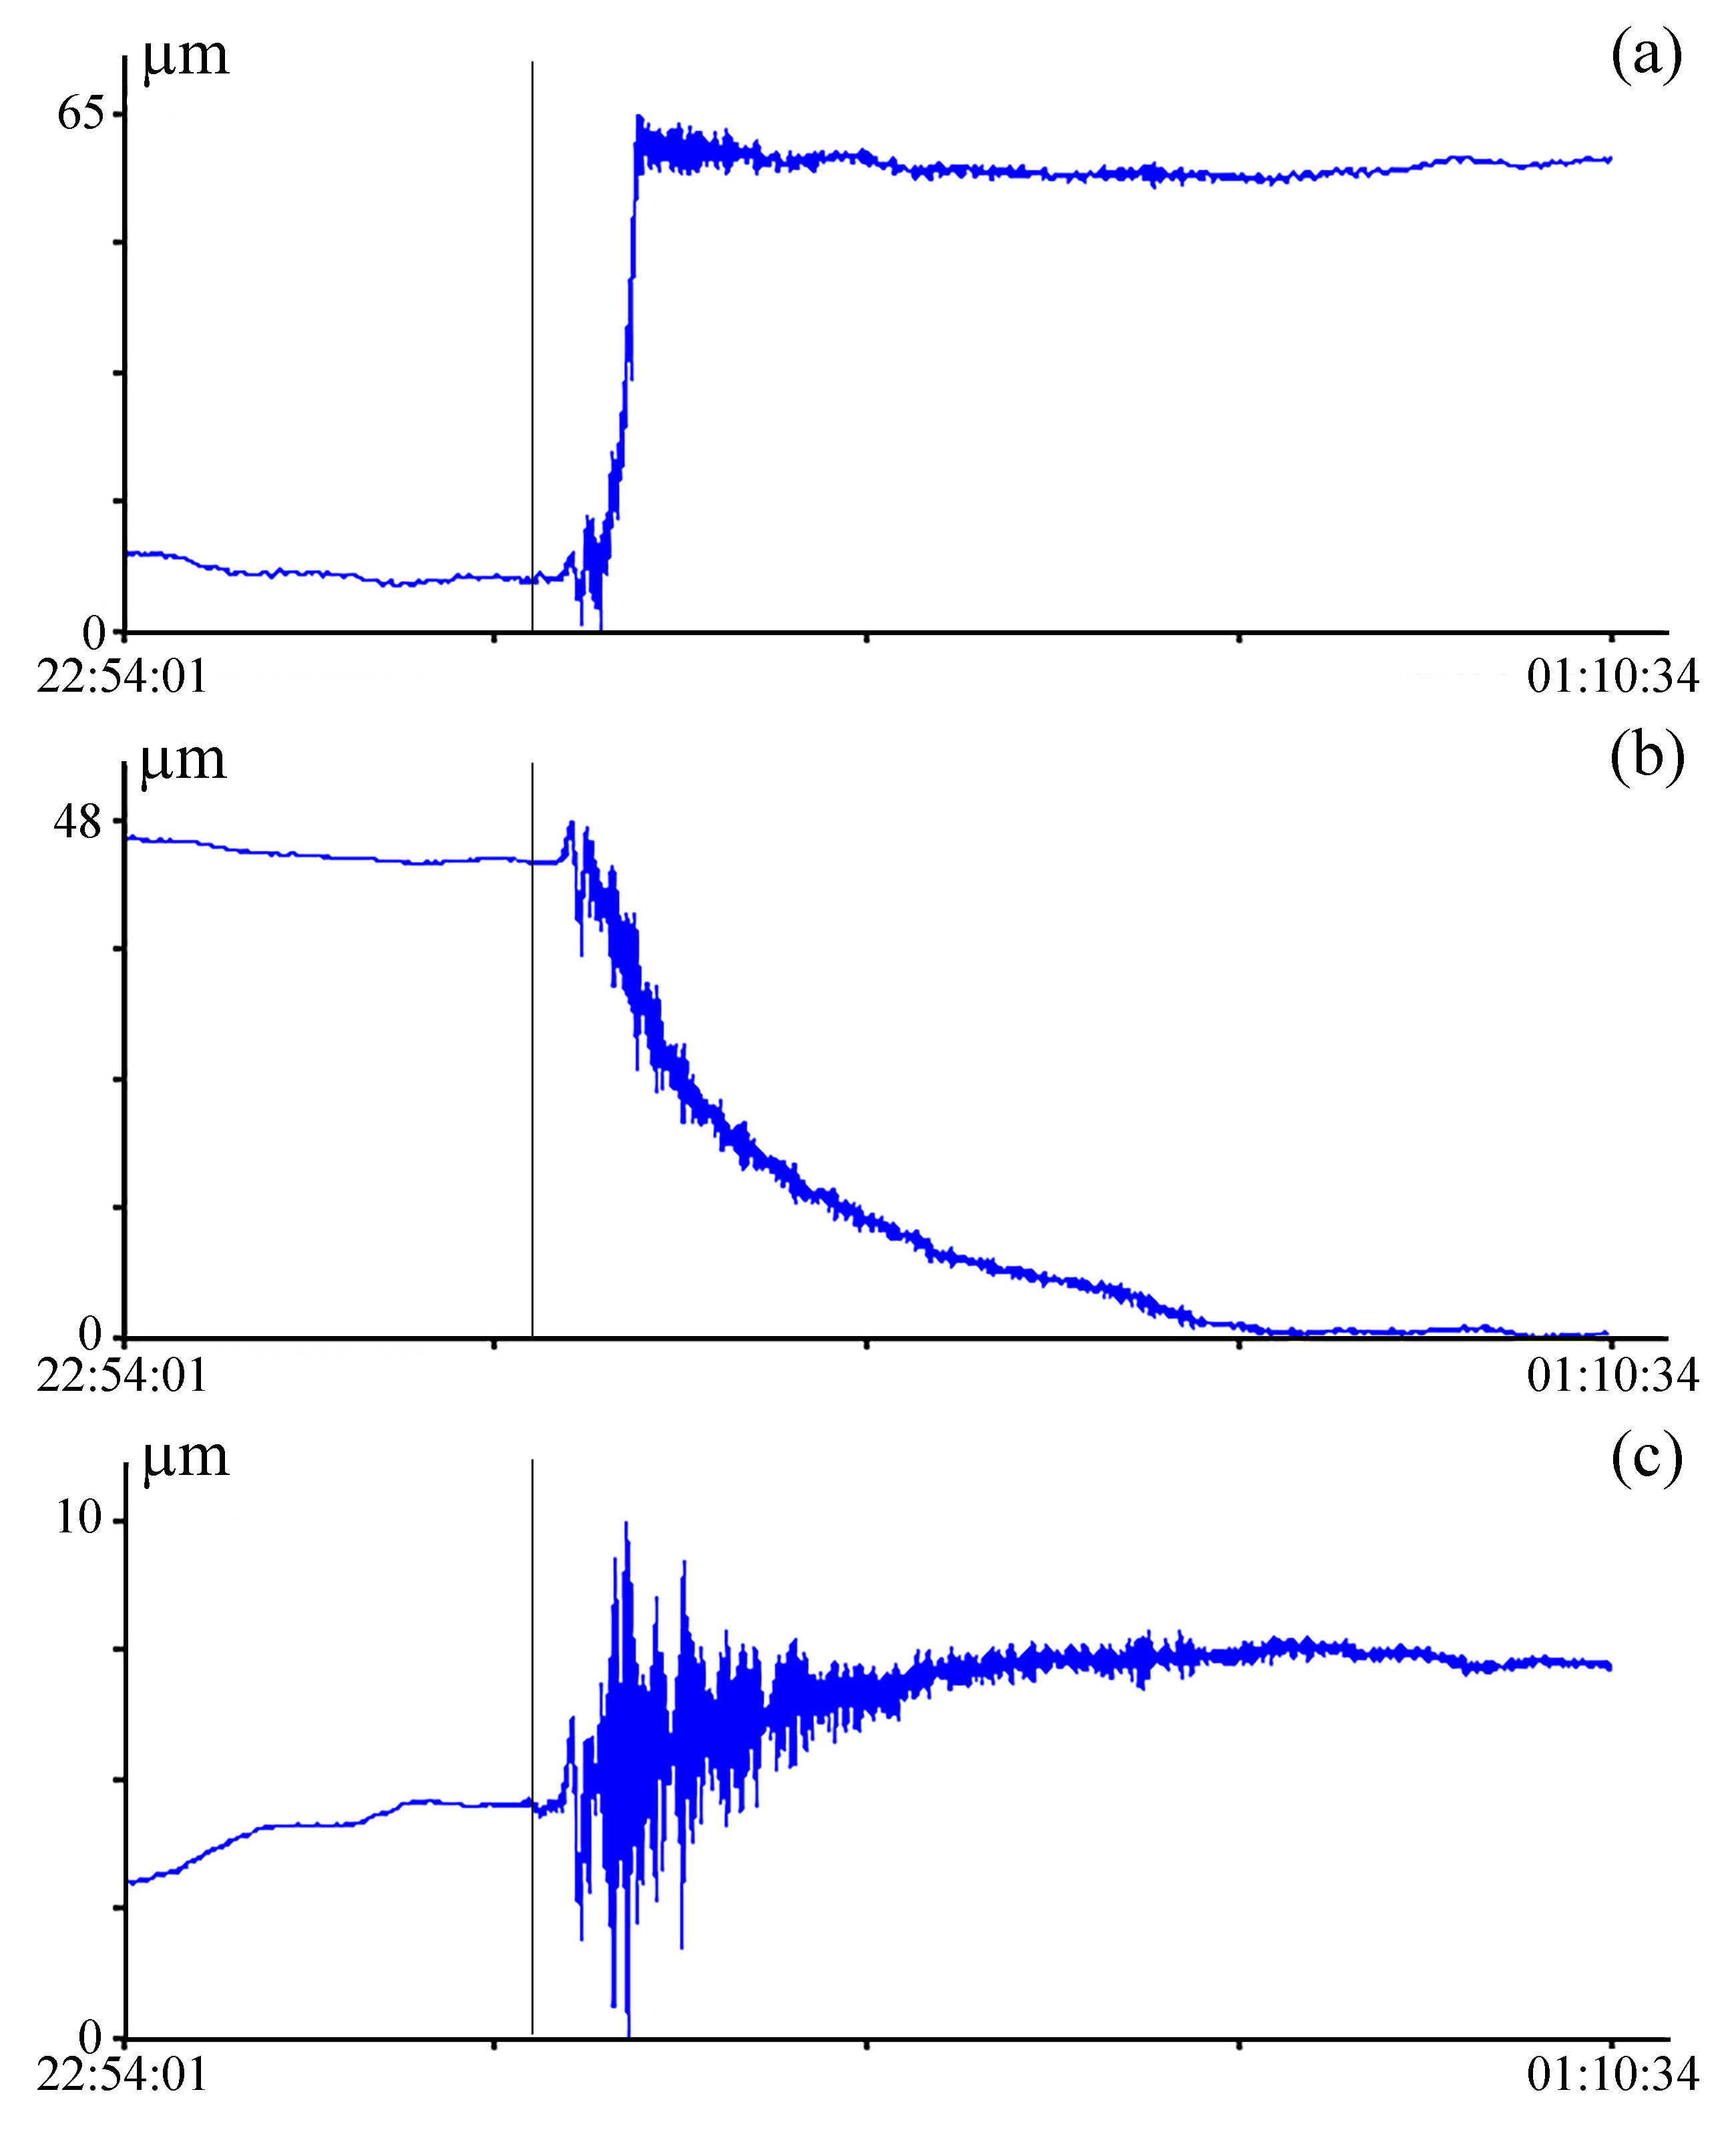
In the records of both 52.5-meter laser strainmeters, NS-1 (Figure 3a) and NS-2 (Figure 3b), a few minutes after the earthquake onset, as indicated by the lines, the records begin to shift abruptly, deviating from the trend. This shift is absent in the record of the third laser interference instrument, WE (Figure 3c). Analysis of the laser strainmeters records showed that the deformation anomaly is clearly visible in the records of instruments with measuring arms located along the North-South axis.
Figure 4 shows fragments of unequal-arm laser strainmeters records of September 13, 2025. Oscillations from another tsunamigenic earthquake, first registered at 02:48:15 UTC, stand out in the records. The magnitude of this earthquake is the same as of the first earthquake, which occurred on July 20, but the epicenter depth is almost 1.7 times greater.
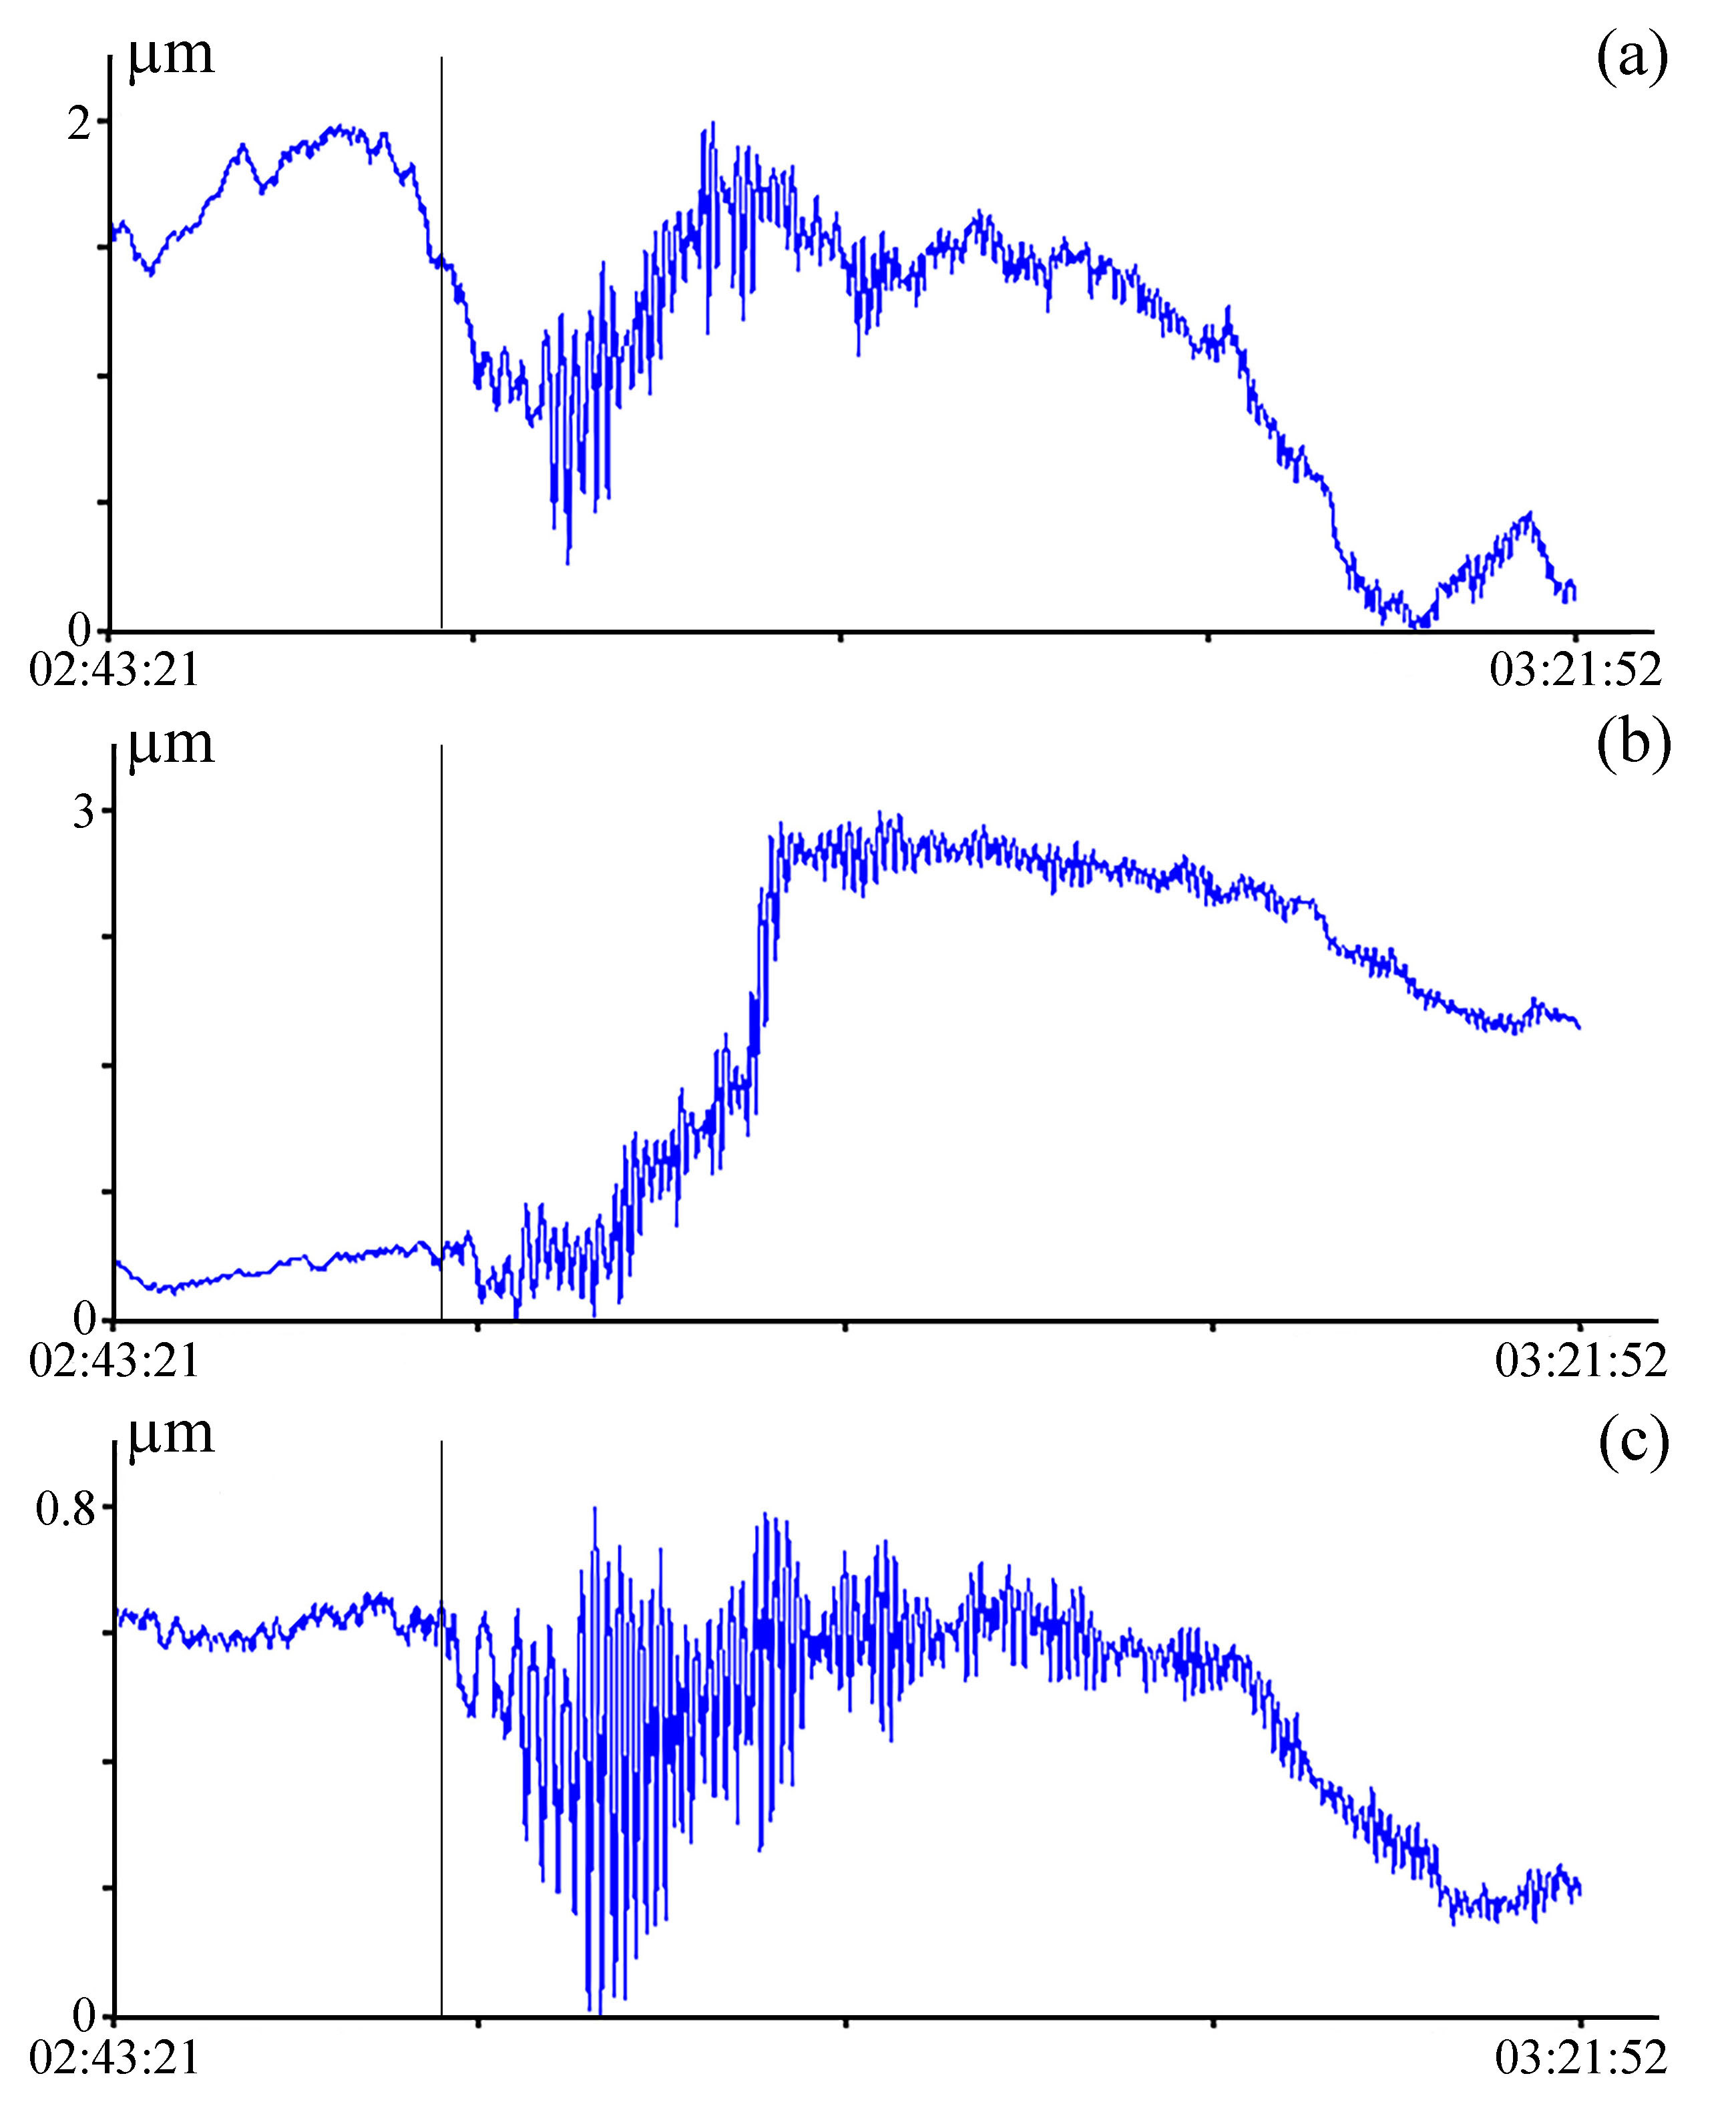
When analyzing laser strainmeters records, we can clearly identify a deformation anomaly only in the record of the NS-2 instrument (Figure 4b). A few minutes after the start of earthquake registration (marked with a line), the record shifts upward. In the records of the other two laser strainmeters (Figures 4a, c), the deformation anomaly is less pronounced. The laser interference instruments records of the last of the earthquakes under consideration are shown in Figure 5. This earthquake was the second largest and closest to the surface, with the hypocenter depth of 30 km. It was recorded by the laser strainmeters at 19:10:30 UTC.
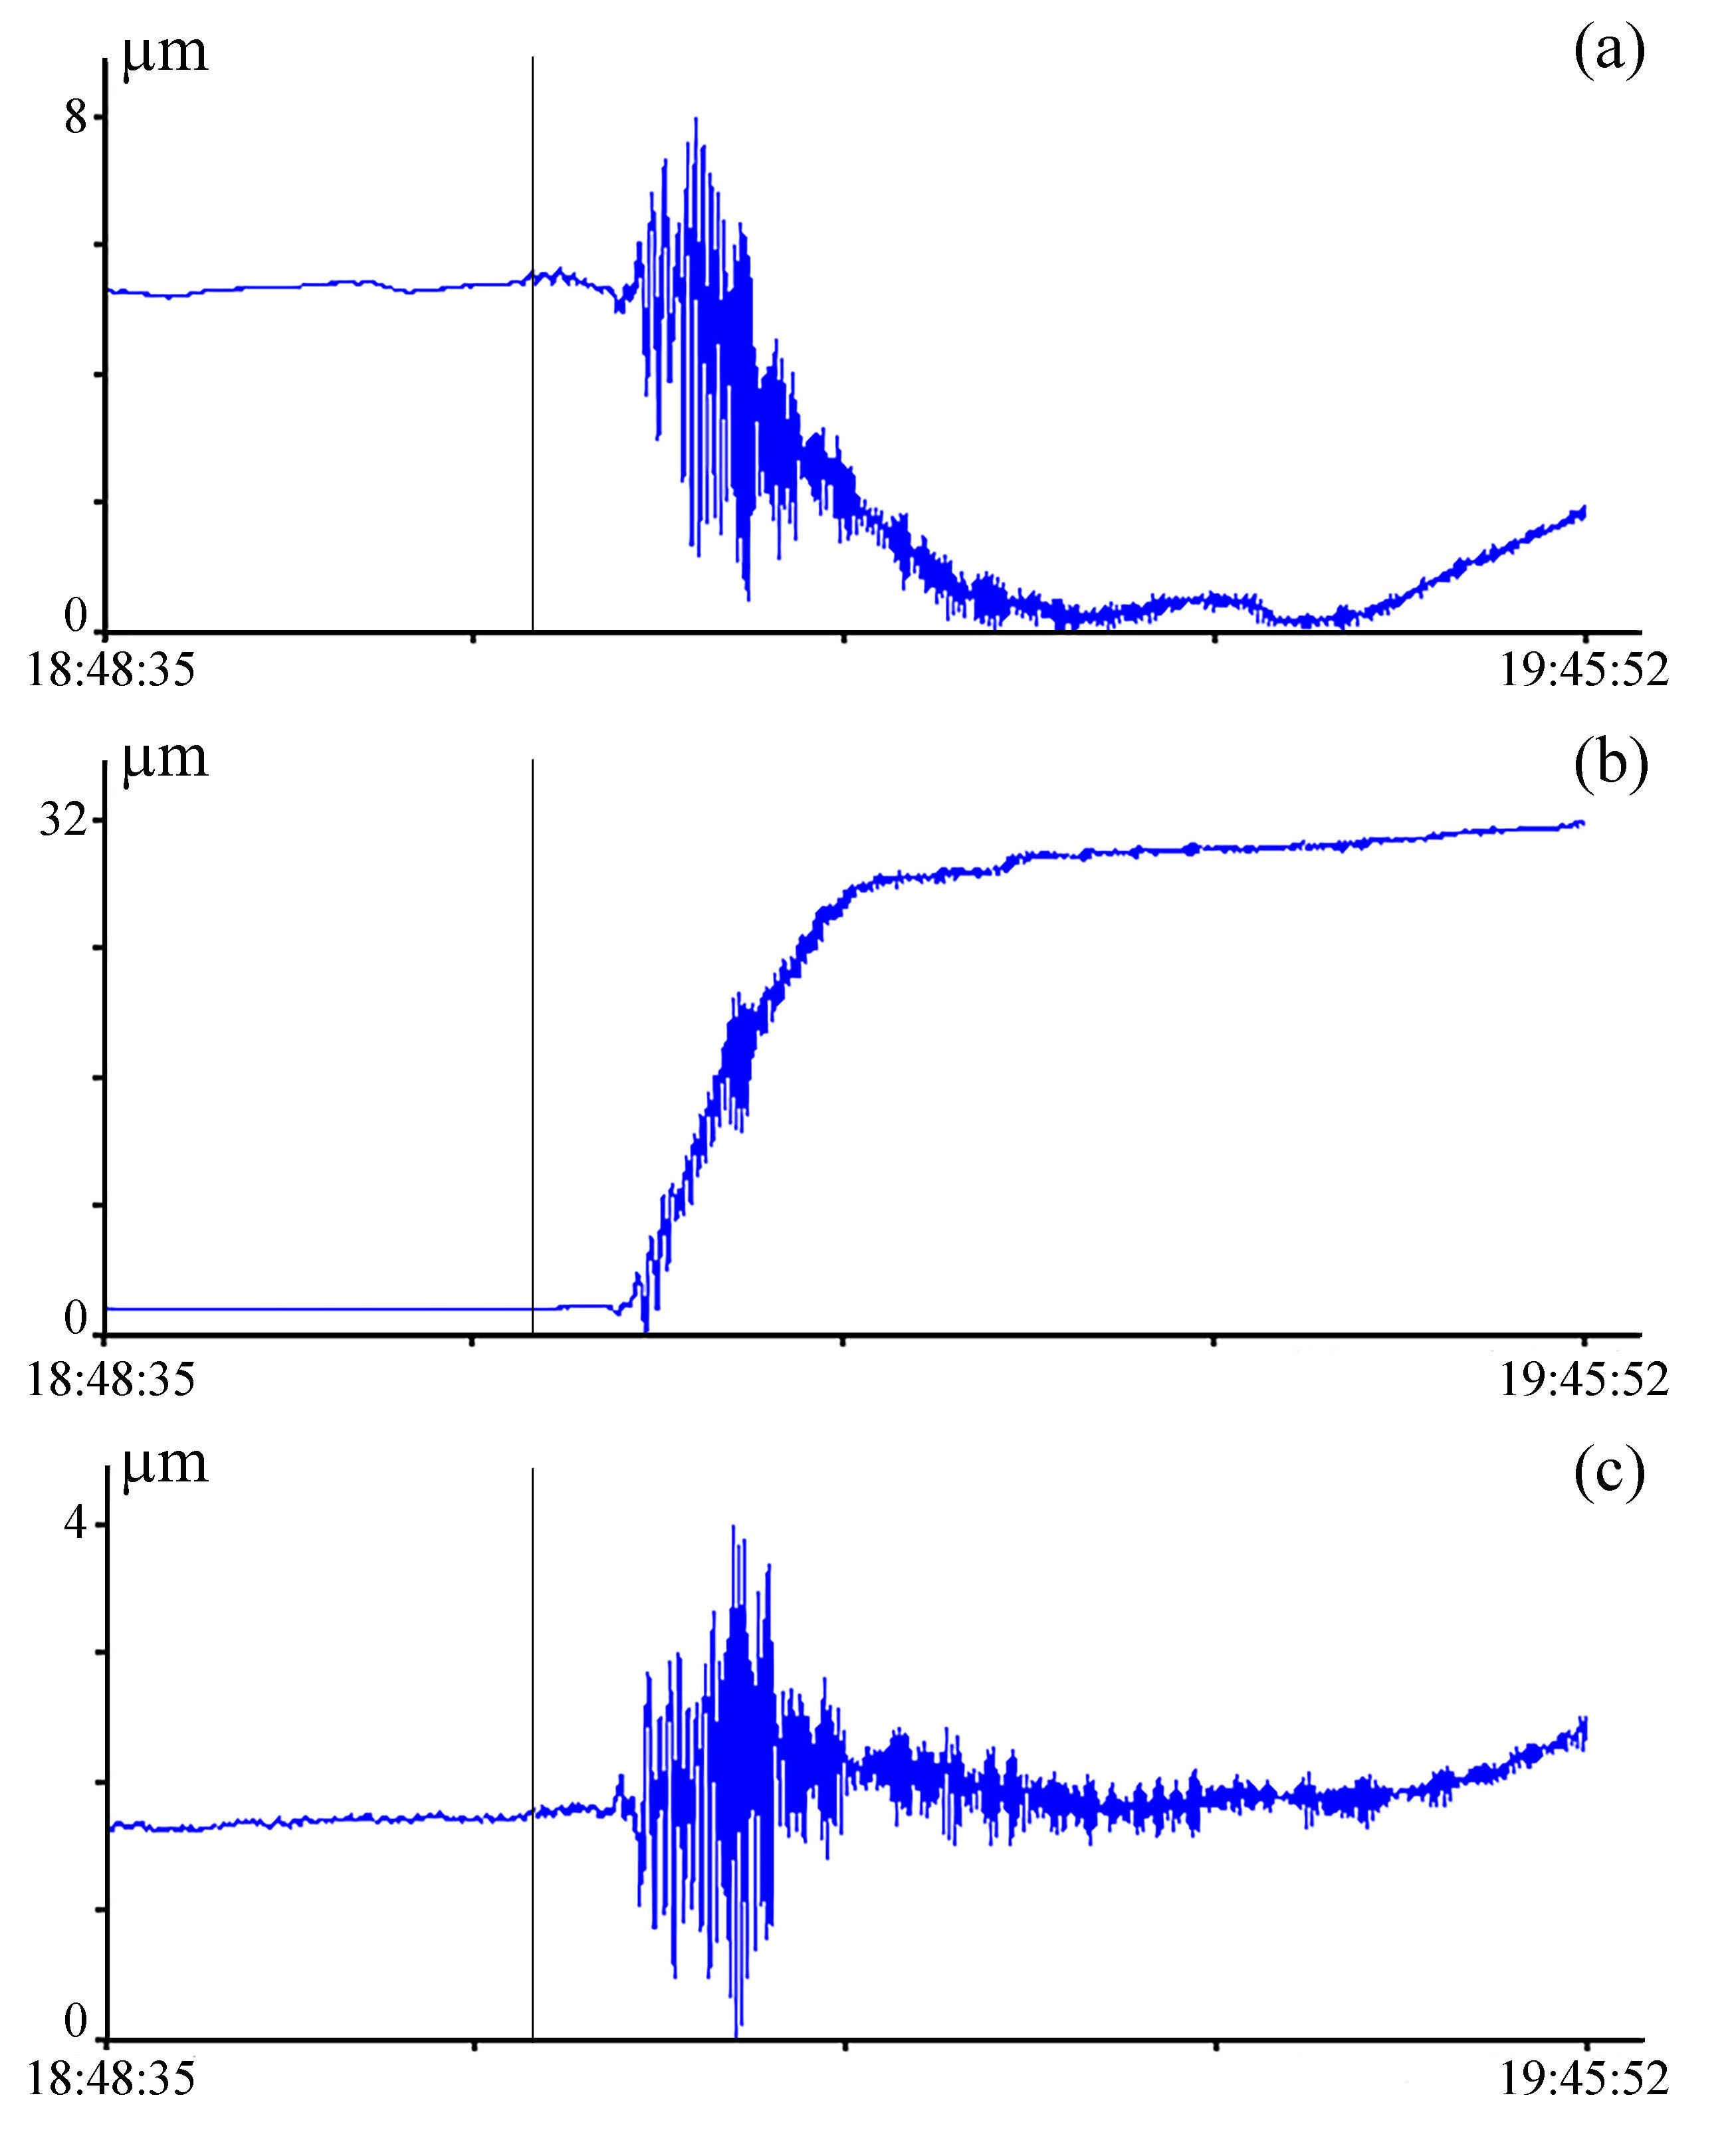
The analysis of laser interference instruments records showed that, in this case, a deformation anomaly can be identified on the NS-1 and NS-2 components (Figures 5a, b). A few minutes after the arrival of the first earthquake oscillations, marked by the line, the instrument records begin to deviate from the trend. The deformation anomaly is absent in the records of the WE component (Figure 5c). In all cases, deformation anomalies are clearly present on the 52.5-meter unequal-arm laser strainmeter NS-2, while deformation anomalies are absent on the 17.5-meter WE laser strainmeter. However, this pattern is not always observed. [Dolgikh and Dolgikh, 2021, 2023] present cases where deformation anomalies are also clearly visible on the WE component.
4. Results and Discussion
Using the data from the unequal-arm laser strainmeters shown in Figures 2–5, we can roughly calculate the deformation anomaly magnitude for all earthquakes. Table 1 lists the deformation anomaly magnitudes for the NS-1 and NS-2 components for each of the tsunamigenic earthquakes.
| Date of earthquake | NS-1, \(\mu \)m | NS-2, \(\mu \)m |
| 20.07.2025 | 0.8 | 4 |
| 29.07.2025 | 47 | 43 |
| 13.09.2025 | 1 | 2.2 |
| 18.09.2025 | 5 | 26 |
The manifestations of deformation anomalies in the records of two 52.5-meter laser strainmeters during the tsunamigenic earthquake that occurred on July 29, 2025, are interesting. Before and after the deformation anomaly, the nature of the records of these laser strainmeters is identical: an increase of the strainmeter base of the NS-1 laser strainmeter is accompanied by a synchronous increase of the base of the NS-2 laser strainmeter, and a decrease in the base of the NS-1 laser strainmeter is accompanied by a decrease in the base of the NS-2 laser strainmeter. Only the magnitudes of these displacements are different. For slow (long-period disturbances), the displacement of the NS-1 laser strainmeter is almost 1.6 times greater than that of the NS-2 laser strainmeter. Let us remind that the central interference units of the NS-1 and NS-2 laser strainmeters are located on the same granite-concrete block, while the corner reflectors are on different granite-concrete blocks mounted on different rocks of the Earth's crust.
The behavior of the deformation anomaly recorded by the NS-1 laser strainmeter differs significantly from that recorded by the NS-2 laser strainmeter. Not only do they differ in magnitude, but most importantly, their behavior is opposite in sign: for the NS-1, the length of the interferometer's measuring arm increases, while for the NS-2, the length of the interferometer's measuring arm decreases.
We also would like to note the characteristic behavior of the deformation recorded by spatially separated laser strainmeters. As we can see from the laser strainmeters records presented in the article [Dolgikh et al., 2025], after the deformation anomaly recorded by the NS-1 laser strainmeter and the 75.5-meter laser strainmeter located at the Baksan Neutrino Observatory, the deformation level did not return to its original state. A shift in deformation occurred without its return to its original neutral state.
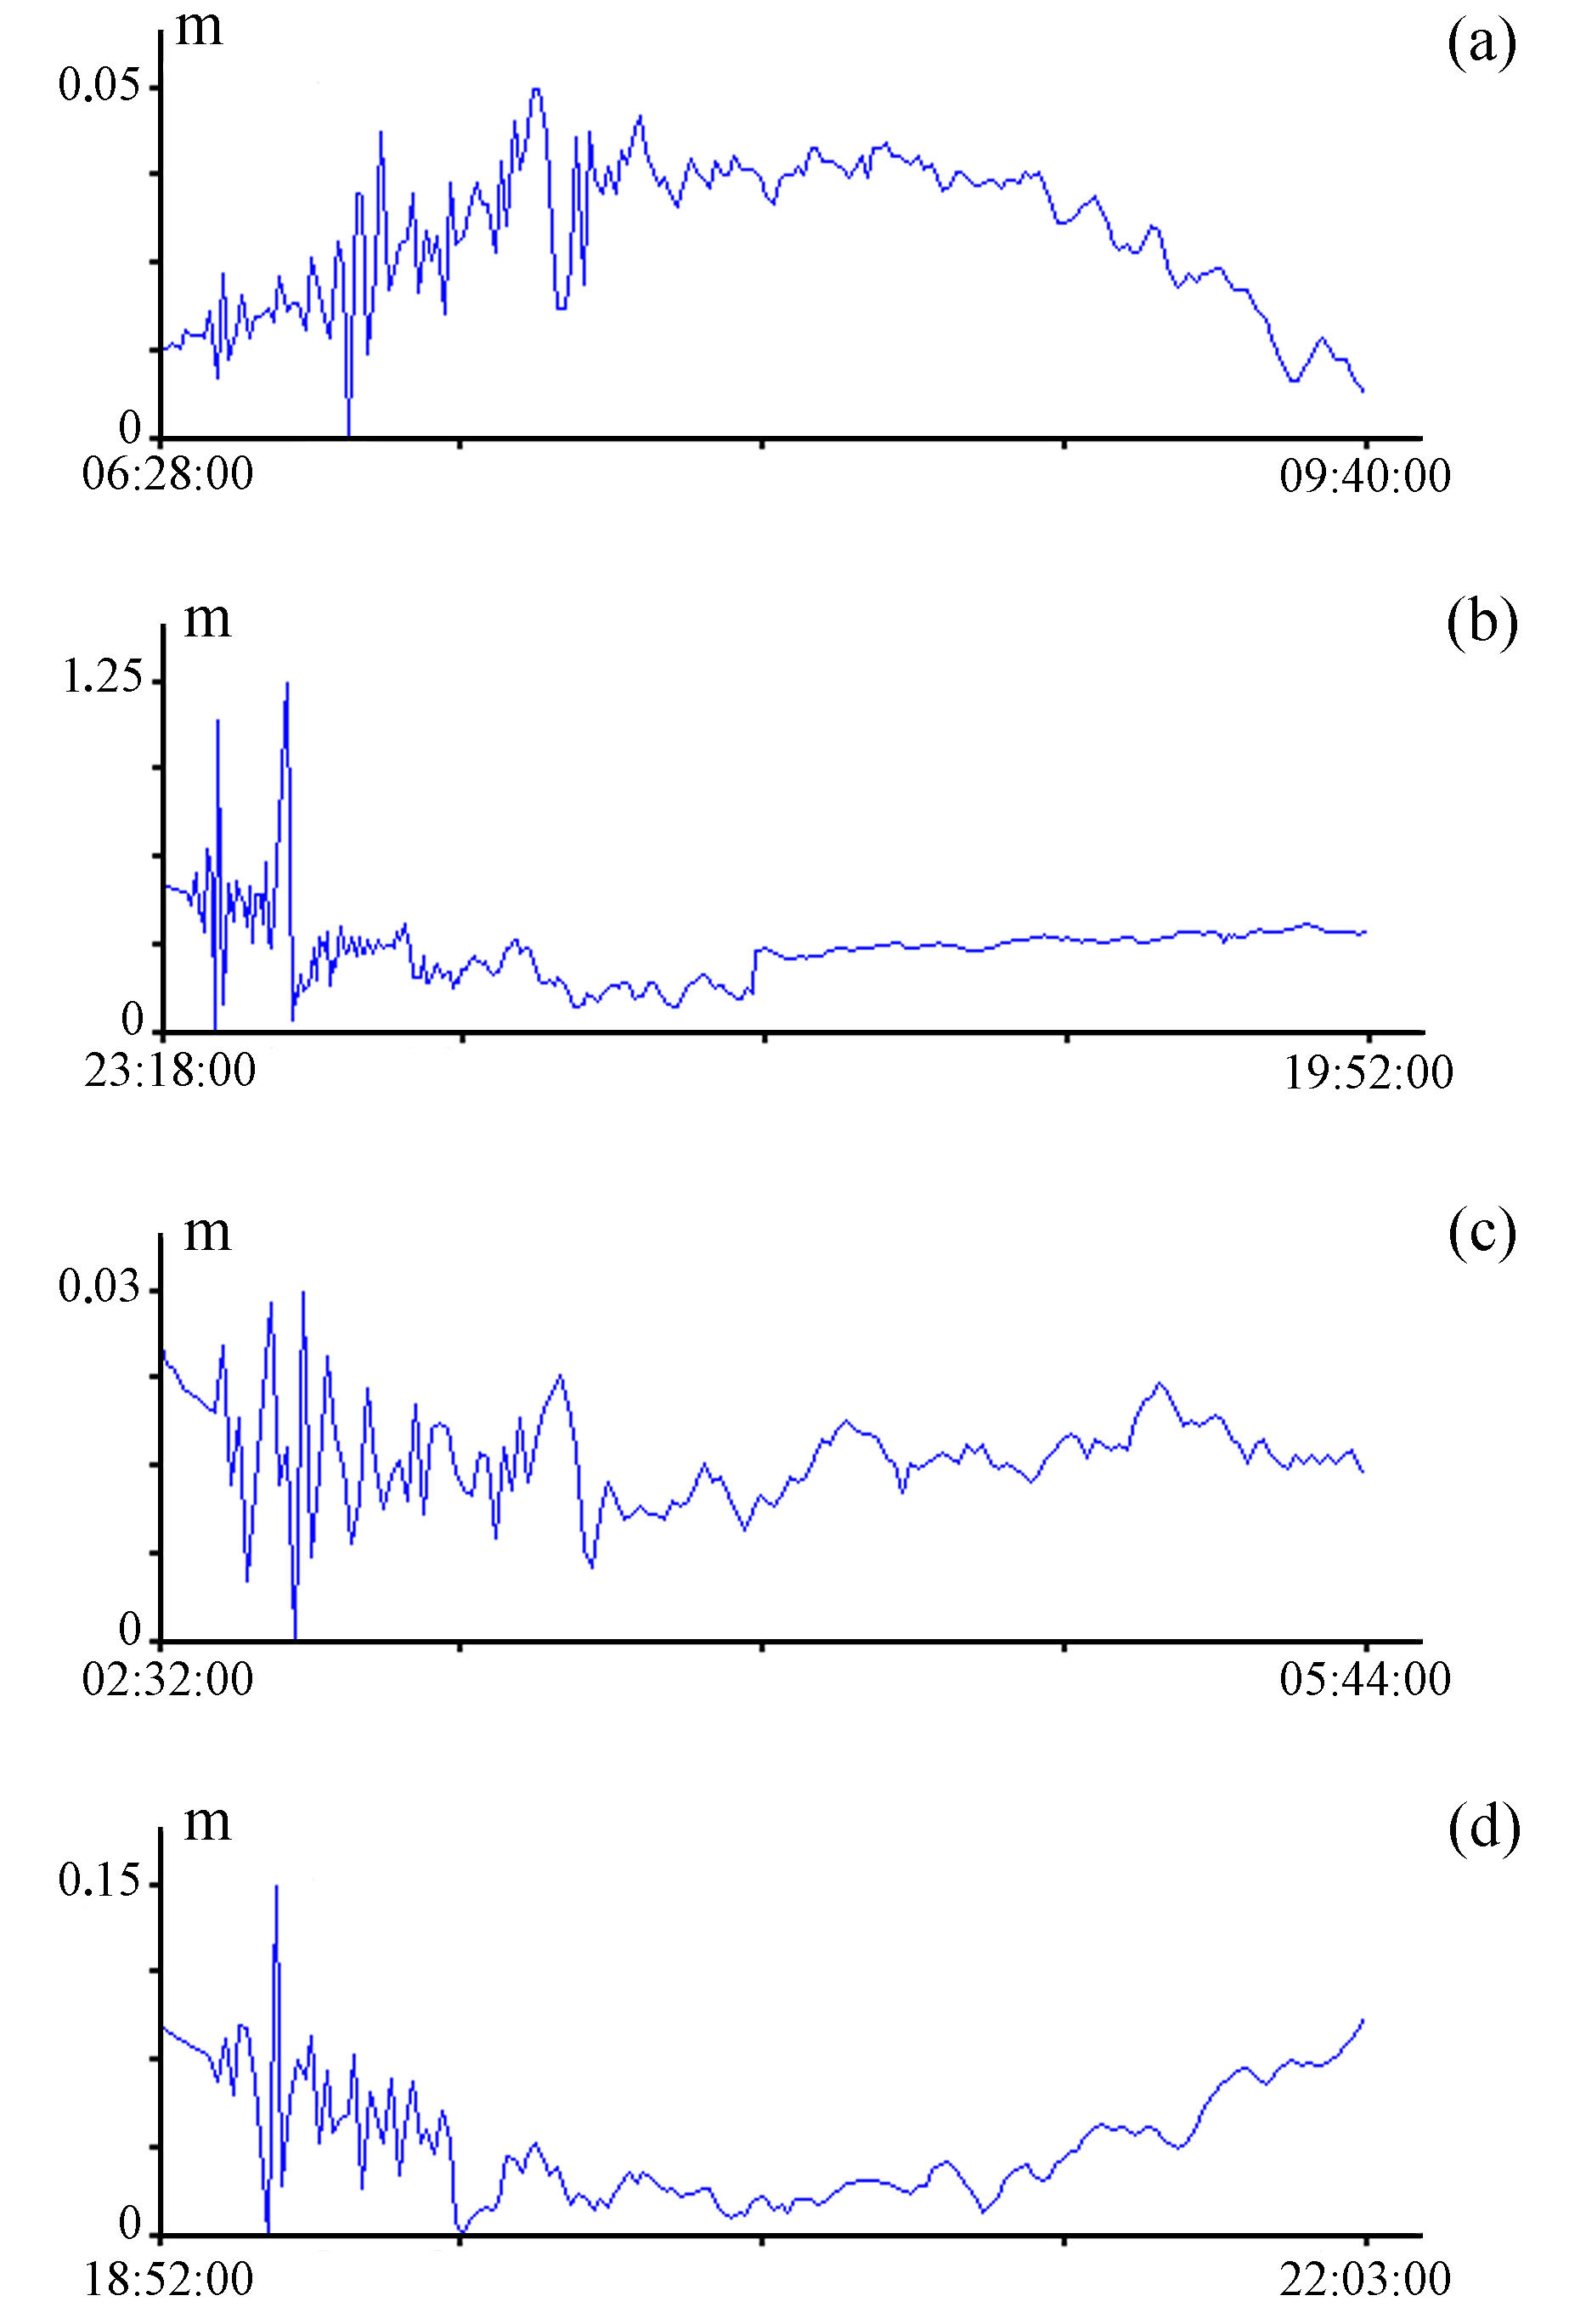
Let us compare the magnitudes of deformation anomalies to the sea waves recorded by the DART buoys. For this comparison, we used data from two buoys located off the coast of the Kamchatka Peninsula and the Kuril Islands. Figure 6 shows fragments of data from a buoy off the Kamchatka coast. From the buoy records, we can calculate the maximum wave amplitude recorded after each earthquake. Thus, for the July 20 earthquake, the wave amplitude was 0.04 m (Figure 6a), the largest amplitude of 1.13 m was recorded after the second earthquake (Figure 6b). After the third earthquake on September 13, the wave amplitude was 0.03 m (Figure 6c), and after the earthquake on September 18, the wave amplitude was 0.15 m (Figure 6d). The magnitude of the sea wave amplitude is in good agreement with the magnitudes of the deformation anomalies recorded by the NS-1 laser strainmeter. The maximum amplitude corresponds to the maximum magnitude of the deformation anomaly.
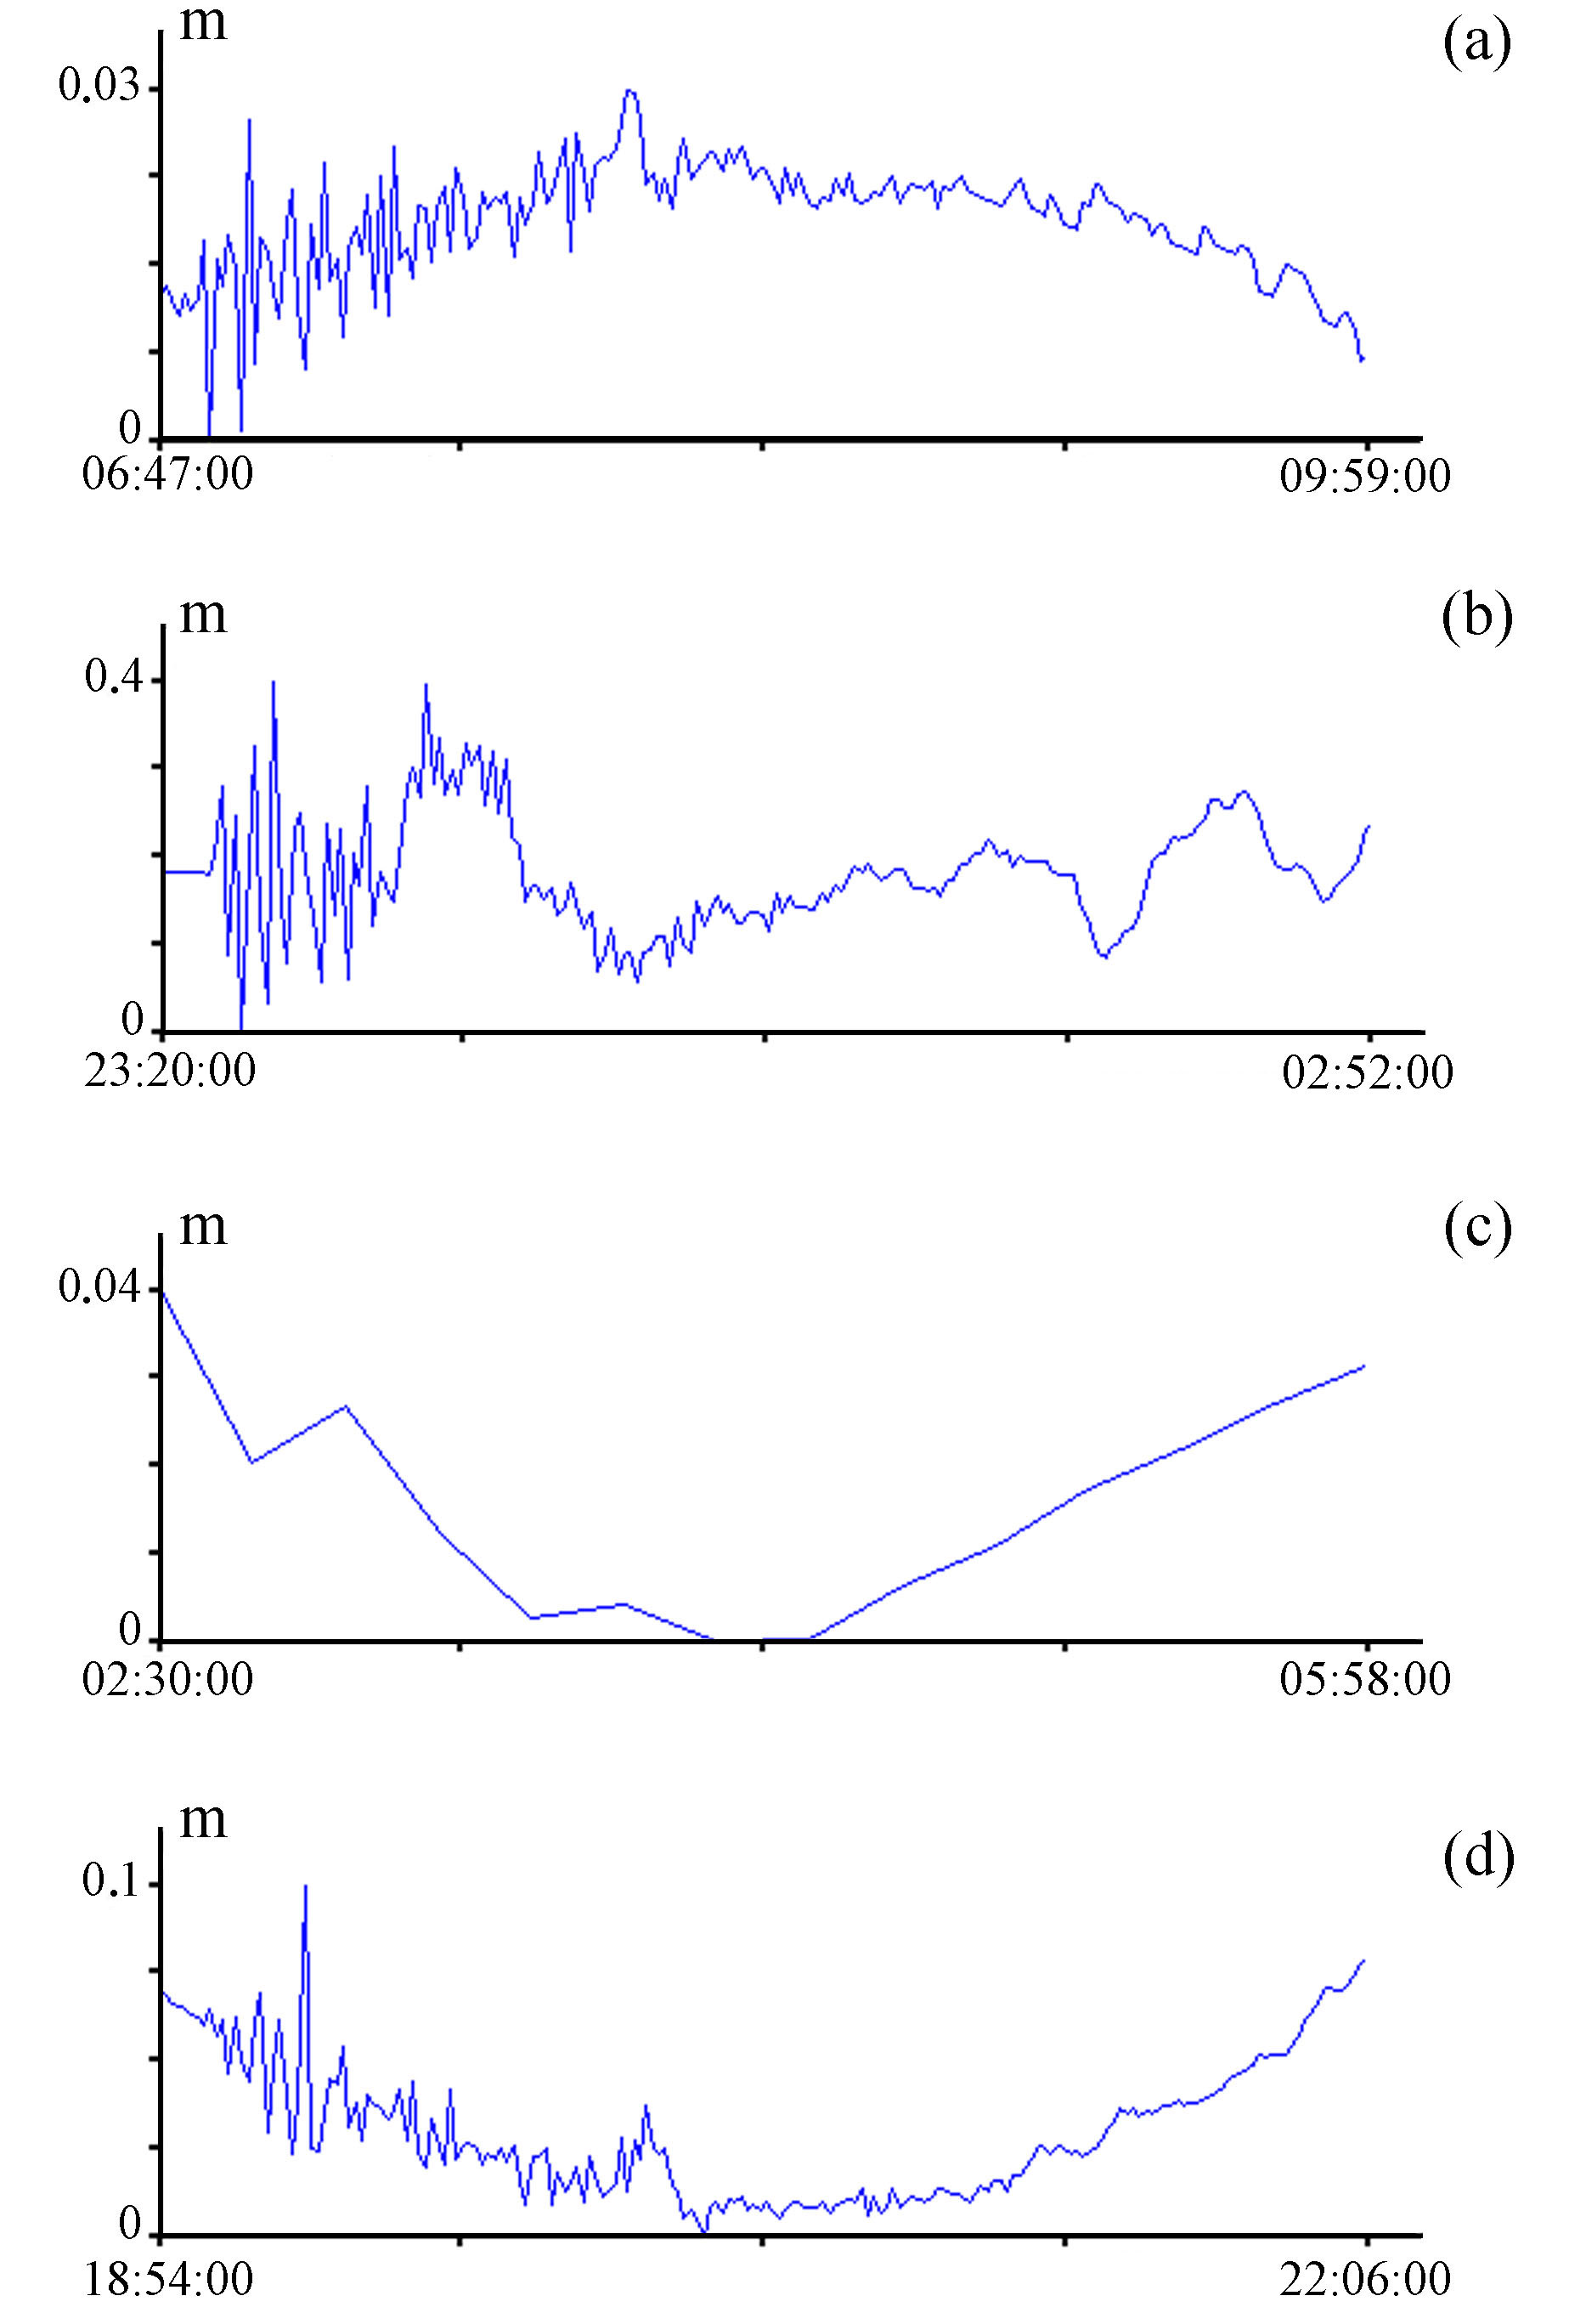
A buoy located near the Kuril Islands recorded a tsunami in three out of four cases (Figure 7). On July 20 and 29, and September 18, the system was triggered and switched to active mode, and on September 13, the system continued recording data in standby mode, once every 15 minutes. Using the buoy data, we calculated the sea wave amplitude after each earthquake. On July 20, the wave amplitude was 0.025 m (Figure 7a). On July 29, the maximum wave amplitude of 0.4 m was recorded (Figure 7b), and on September 18, the maximum sea wave amplitude was 0.075 m (Figure 7d). This buoy is located significantly farther from the earthquake epicenters than the first. However, in all cases, the amplitude of the recorded wave is in good agreement with the magnitudes of deformation anomalies calculated using data from the NS-1 laser strainmeter.
5. Conclusion
The analysis of data from unequal-arm laser strainmeters located at the “Shultz Cape” MES, POI FEB RAS, in the south of the Primorsky Territory revealed deformation anomalies during registration of four tsunamigenic earthquakes. These deformation anomalies are most pronounced in the records of the NS-2 laser strainmeter, one optical element of which is located on a sand cushion and is not rigidly connected to the bedrock. Experimental data from DART buoys located near the earthquake epicenters are in good agreement with the deformation anomaly values of the NS-1 laser strainmeter. The optical elements of this instrument are rigidly connected to the bedrock. The NS-2 laser strainmeter is more suitable for determining whether an earthquake is tsunamigenic, while the NS-1 strainmeter is more suitable for more accurate tsunami magnitude calculations. The nature of the deformation anomaly recorded by laser interference instruments depends on the elastic properties of the rocks, on which their abutments are located. The calculation of the relationship between the magnitude of deformation anomalies and the magnitude of seabed displacement in the earthquake epicenter is required, as well as the development of a short-term tsunami forecasting methodology based on data from laser strainmeters located at various distances.
Acknowledgments.
The work was carried out in the laboratory of Nonlinear hydrophysics and natural disasters with the financial support from the state-funded research program of the POI FEB RAS No. 125020601583-5 “Nonlinear Hydrophysics with Applications to Natural Disasters of the Far Eastern Region”.
1. Conroy G. Japan earthquakes: the science behind the deadly tremors // Nature. — 2024. — Vol. 625. — https://doi.org/10.1038/d41586-024-00010-1
2. Dolgikh G. and Dolgikh S. Deformation Anomalies Accompanying Tsunami Origination // Journal of Marine Science and Engineering. — 2021. — Vol. 9, no. 10. — P. 1144. — https://doi.org/10.3390/jmse9101144
3. Dolgikh G. and Dolgikh S. Deformation Anomalies Accompanying Tsunami Origins near the Japanese Islands // Journal of Marine Science and Engineering. — 2023. — Vol. 11, no. 11. — P. 2137. — https://doi.org/10.3390/jmse11112137
4. Dolgikh G. I., Batyushin G. N., Valentin D. I., et al. Seismoacoustic Hydrophysical Complex for Monitoring the Atmosphere-Hydrosphere-Lithosphere System // Instruments and Experimental Techniques. — 2002. — Vol. 45, no. 3. — P. 401–403. — https://doi.org/10.1023/a:1016031925259
5. Dolgikh G. I. and Dolgikh S. G. The Pacific Tsunamigenic Earthquakes in the Early 2024 // Journal of Volcanology and Seismology. — 2024. — Vol. 18, no. 6. — P. 509–514. — https://doi.org/10.1134/s0742046324700842
6. Dolgikh G. I., Dolgikh S. G., Kovalev S. N., et al. A deformation method for determining the tsunami potential of earthquakes // Doklady Earth Sciences. — 2007. — Vol. 417, no. 1. — P. 1261–1264. — https://doi.org/10.1134/s1028334x07080296
7. Dolgikh G. I., Kulchin Yu. N., Dolgikh S. G., et al. Deformation Anomalies of the Tsunamigenic Earthquake of July 29, 2025 // Doklady Earth Sciences. — 2025. — Vol. 525, no. 2. — P. 1–3. — https://doi.org/10.1134/s1028334x2560879x
8. Hirose F., Tamaribuchi K., Kobayashi A., et al. Relation between earthquake swarm activity and tides in the Noto region, Japan // Earth, Planets and Space. — 2024. — Vol. 76, no. 1. — https://doi.org/10.1186/s40623-024-01985-x
9. Mao Zh., Chen Ch.-H., Yisimayili A., et al. Seismo-Traveling Ionospheric Disturbances from the 2024 Hualien Earthquake: Altitude-Dependent Propagation Insights // Remote Sensing. — 2025. — Vol. 17, no. 7. — P. 1241. — https://doi.org/10.3390/rs17071241
10. Wei Y., Newman A. V., Hayes G. P., et al. Tsunami Forecast by Joint Inversion of Real-Time Tsunami Waveforms and Seismic or GPS Data: Application to the Tohoku 2011 Tsunami // Pure and Applied Geophysics. — 2014. — Vol. 171, no. 12. — P. 3281–3305. — https://doi.org/10.1007/s00024-014-0777-z